The report explains how the outage of a single AS affects the global connectivity of the region, especially when it is the biggest ISP of a given country. Internet connectivity at the network level is driven by the interaction between autonomous systems (AS’s). As the number of alternate routes between AS’s increases, so goes the fault-resistance and stability of the internet in a given country. However, some paths become more important than others and having as many alternate routes as possible is the only viable way ensure the system is adequately robust.
The global connectivity of any AS, regardless of whether it is a minor provider or an international giant, depends on the quantity and quality of its paths to Tier-1 ISP’s. Usually, Tier-1 implies an international company offering global IP transit service over connections to other Tier-1 providers. But there is no obligation to maintain such connectivity. Only the market can motivate them to peer with other Tier-1’s to deliver the highest quality service. Is that motivation enough? We explore this question in the IPv6 section below. If an ISP loses its connection to at least one of its Tier-1 peers, it would likely become unreachable in some parts of the world.
Measuring Internet Reliability
Imagine that an AS is experiencing significant network degradation. We want to answer the following question: “What percentage of AS in this region would lose their connectivity with Tier-1 operators, thereby losing global availability?”
Why model such a situation? Strictly speaking, when the BGP and the world of interdomain routing were in the design stage, the creators assumed that every non-transit AS would have at least two upstream providers to guarantee fault tolerance in case one goes down. However, the reality is different; more than 45% of ISP’s have only one connection to an upstream transit provider. A set of unconventional relationships among transit ISPs further reduces reliability. So, did transit ISPs ever fail? The answer is yes, and this happens rather often. The proper question is — when would a particular ISP experience service degradation? If such problems seem remote, it may be worth considering Murphy’s Law: “Anything that can go wrong, does.”
To model such a scenario, we have applied the same model for the third year in a row, but we did not merely repeat previous calculations; this year we’ve expanded the research significantly. The followed steps were taken to rate AS reliability:
- For every AS in the world, we retrieved all alternate paths to Tier-1 operators with the help of an AS relation model, core of the Qrator.Radar;
- Using the IPIP geodatabase, we matched countries to the declared address of every AS;
- For every AS we counted the share of its address space that corresponds to the selected region. It helped to filter out situations where an ISP may be present at an internet exchange point in the given country but not have any significant presence in the region. A good example is Hong Kong, where hundreds of members of the biggest Asian Internet Exchange HKIX exchange traffic but have zero presence in the Hong Kong internet segment itself;
- After realizing clear results of the region’s AS’s, we evaluated the effect of a possible failure of a given AS on the other AS’s and the specific countries where they operate;
- In the end, for each country, we found the specific AS that affects the largest portion of other AS’s in the given region. Foreign AS’s are not considered.
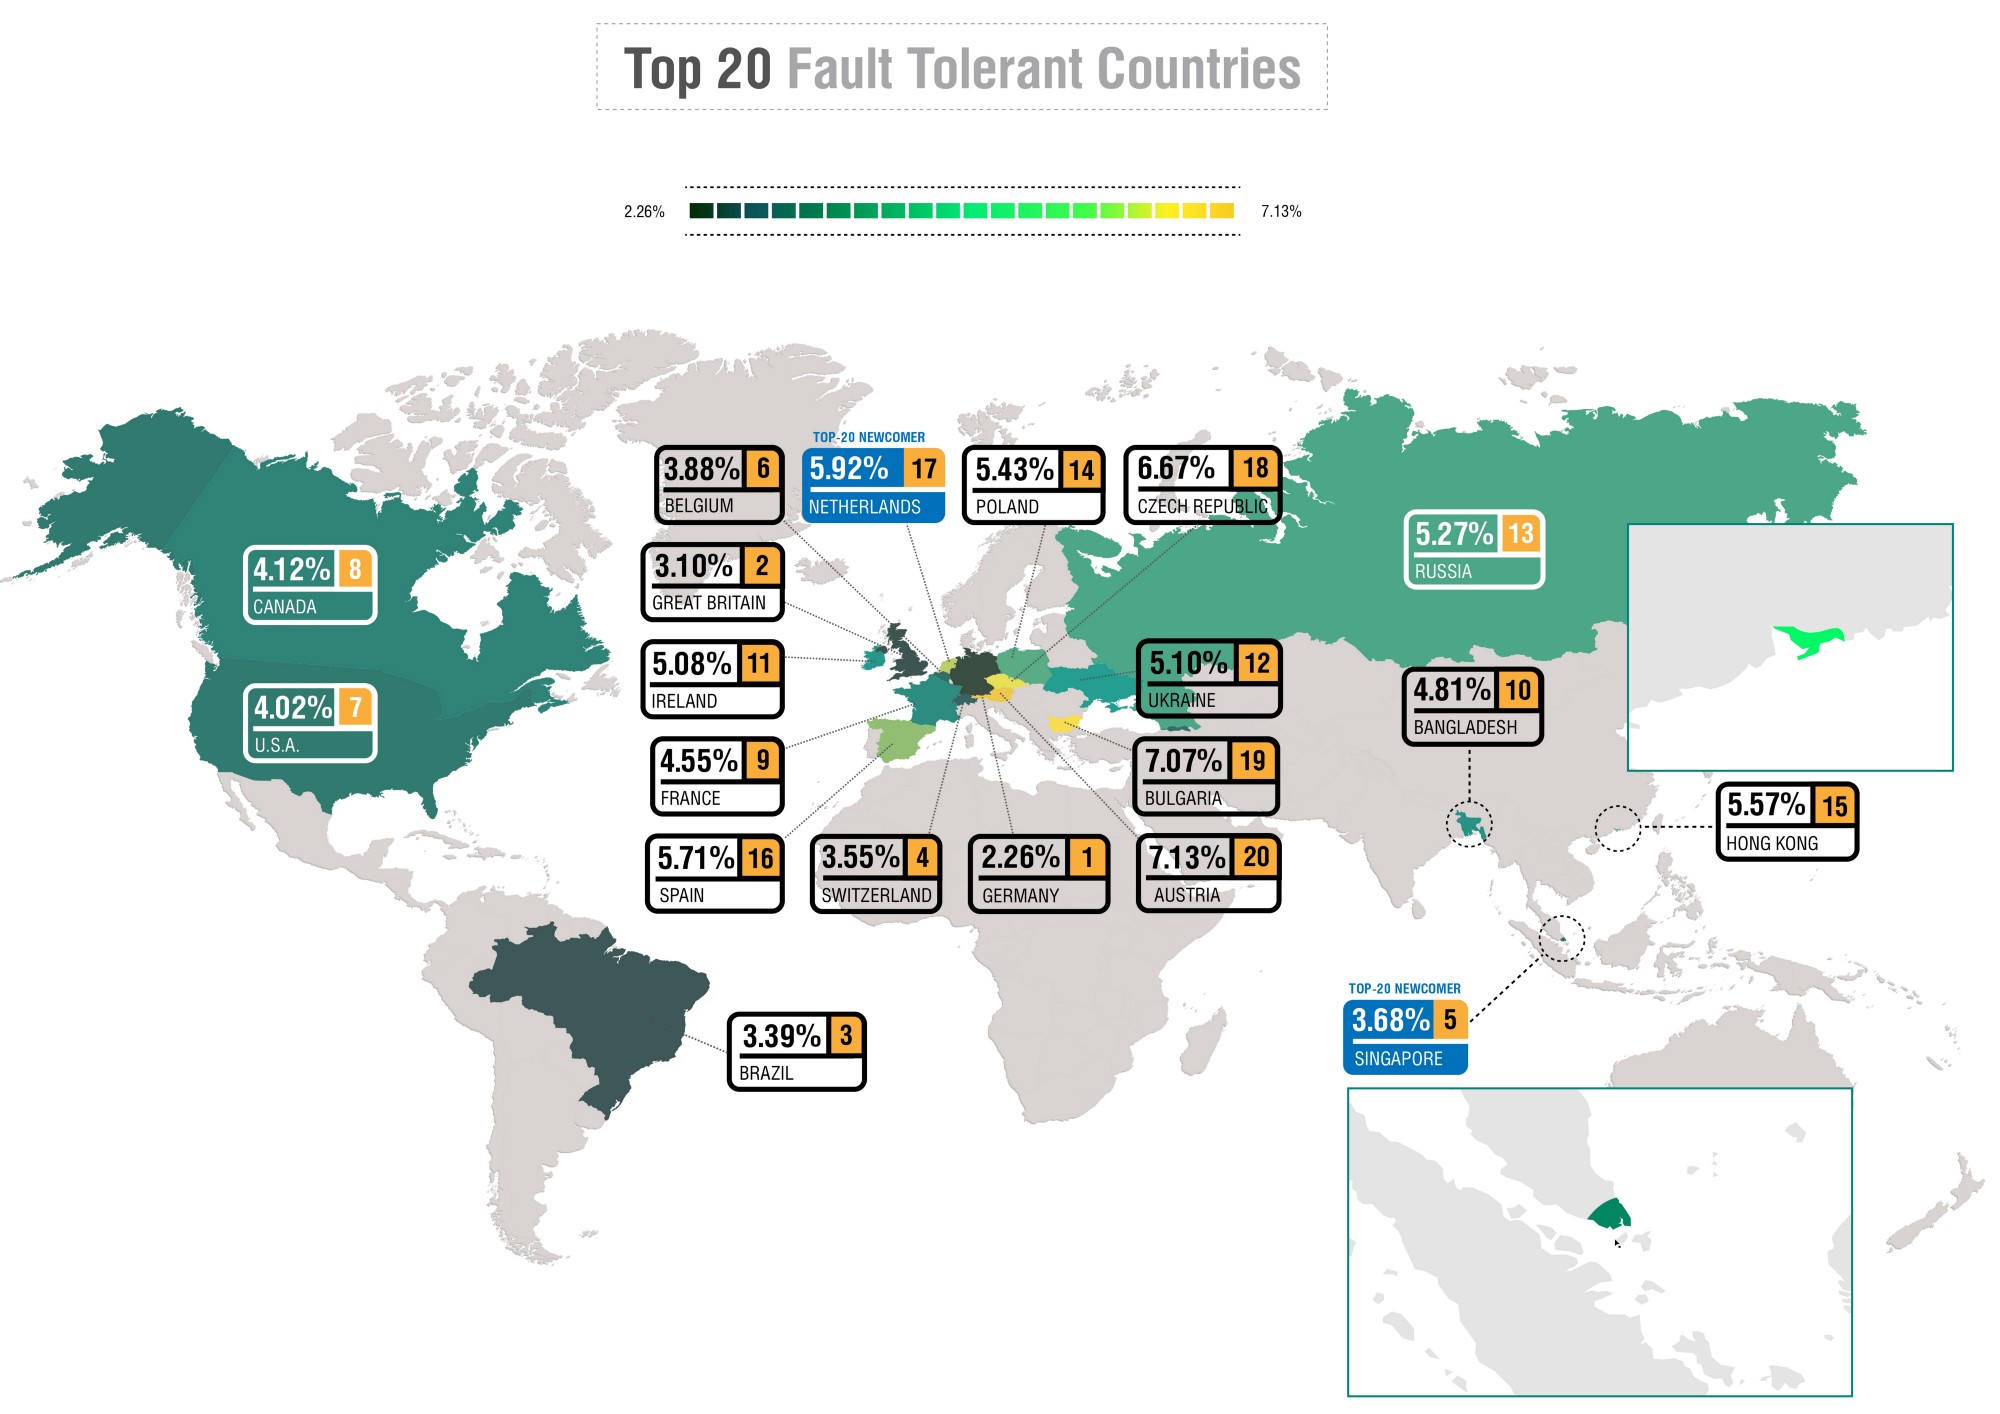
IPv4 Reliability
TL;DR quick facts:
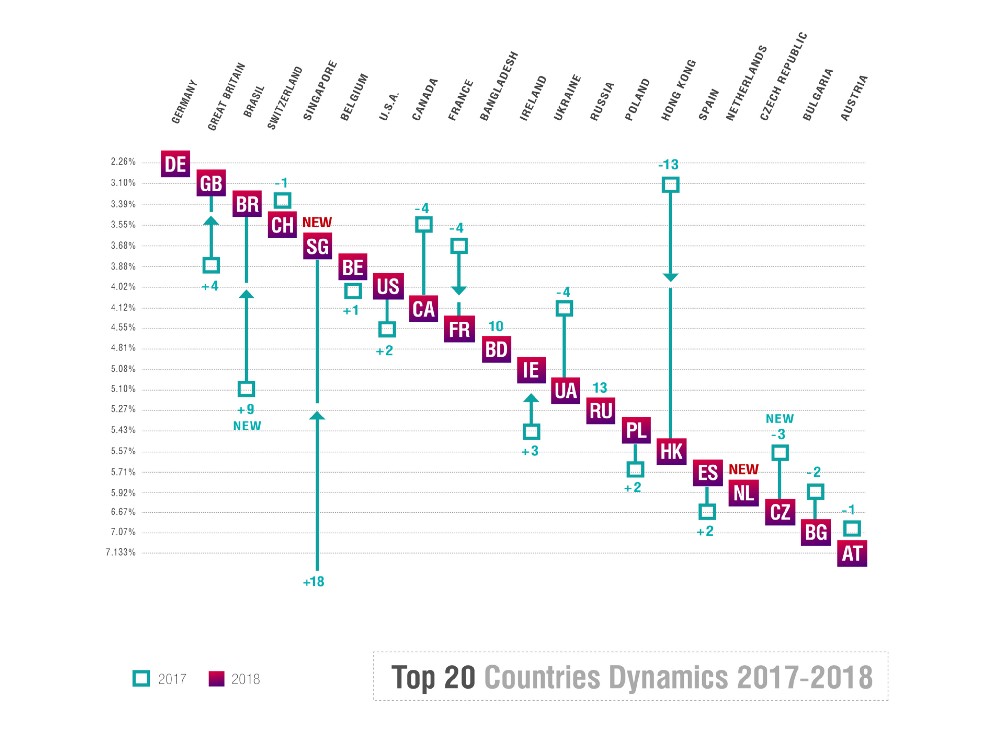
Romania and Luxembourg fell out of the top-20 from 11th and 20th place, respectively, in 2017;
Singapore jumped 18 places to 5th;
Hong Kong fell 13 places to 15th;
The Netherlands entered the top-20 for the first time in 17th place.
18 of 20 countries remained in top-20 compared to last year.
While individual countries may have moved up or down the list, overall performance did not change significantly from 2017. Last year the average outage from a single failure was 41% and in 2018 it decreased by 3 percent to approximately 38%. The number of countries that limited outage to less than 10% (indicating fault resistance) increased by one to reach 30.
The primary trend for the year was found to be the significant reliability improvements in small countries of South Asia and Africa. These regions are still developing, but strong improvements in IP-transit market diversity are a sign of accelerating progress.
Game of IPv6
It is commonly believed that if a technology works well in IPv4, it could be easily ported to IPv6. This mistaken assumption may be the most significant structural problem of the whole IPv6 development process.
Measuring global reliability between the two protocol versions is not as straightforward as it might seem. To maintain global connectivity under IPv4, any single path to a Tier-1 provider is adequate. But in IPv6 this may not be enough. Due to ongoing peering wars between several Tier-1 providers in IPv6, they are not all connected to each other. At least two pairs of providers decided to “de-peer” in IPv6: Cogent (AS174) and Hurricane Electric (AS6939); Deutsche Telekom (AS3320) and Verizon US (AS701). These telecoms may have different reasons for their conflicts, but if a network is connected only to one party in the conflict, it would not have full IPv6 connectivity. It also affects the reliability of ISP’s with multiple upstream providers — the outage of one may lead to connectivity problems.
To address these issues, we adjusted our measurement process to check whether full IPv6 connectivity is maintained during an outage. In other words, paths for all Tier-1 providers must be present to maintain full connectivity. We also calculated the percentage of AS’s in the country that have only partial connectivity due to these peering wars. Here are the results:
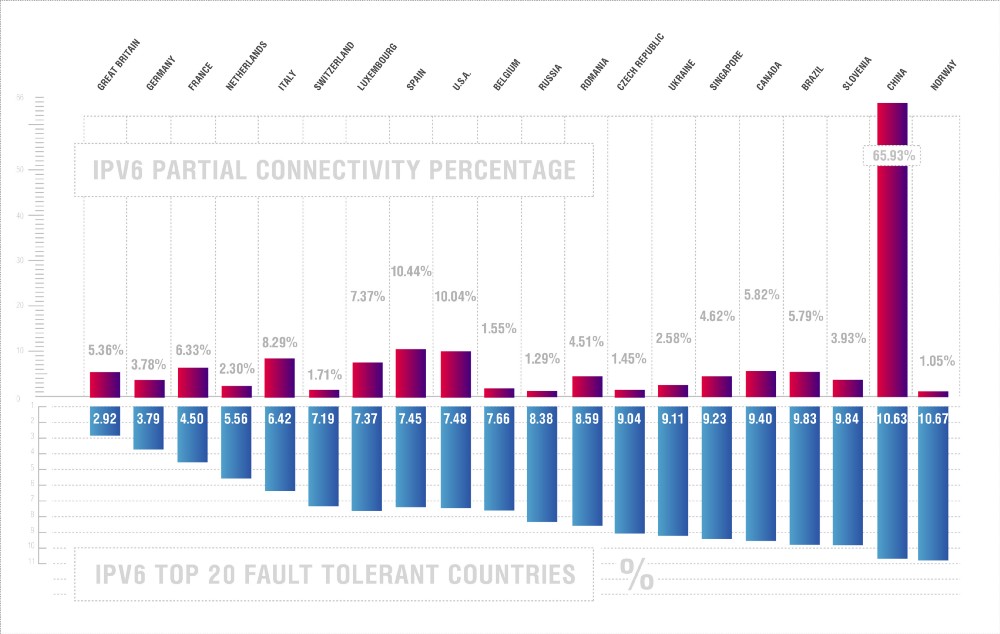
The overall comparison of IPv4 and IPv6 in case of a single failure shows that for 86% of countries, IPv4 connectivity is more reliable. An important discovery in the world of IPv6 is that many ISP’s do not have proper connectivity under normal operating conditions without any outages. For example, in the US this applies to approximately 10% of all AS’s that have IPv6 support, and in China the situation is even worse with China Telecom (AS4134) getting global connectivity from only one provider — Hurricane Electric.
As stated above, nobody can force Tier-1 providers to peer with each other except their customers. Data clearly shows that user demand is not incentive enough for them to connect to each other and achieve 100% network visibility. Explicit market calls for proper IPv6 service seem to be the only way to improve the situation. The Qrator.Radar team is considering different options to make this information transparent for every ISP in the world, thus improving community awareness of the problem.
Regarding partial connectivity — a few countries don’t “see” more than 20% of the overall IPv6 address space. Those are:
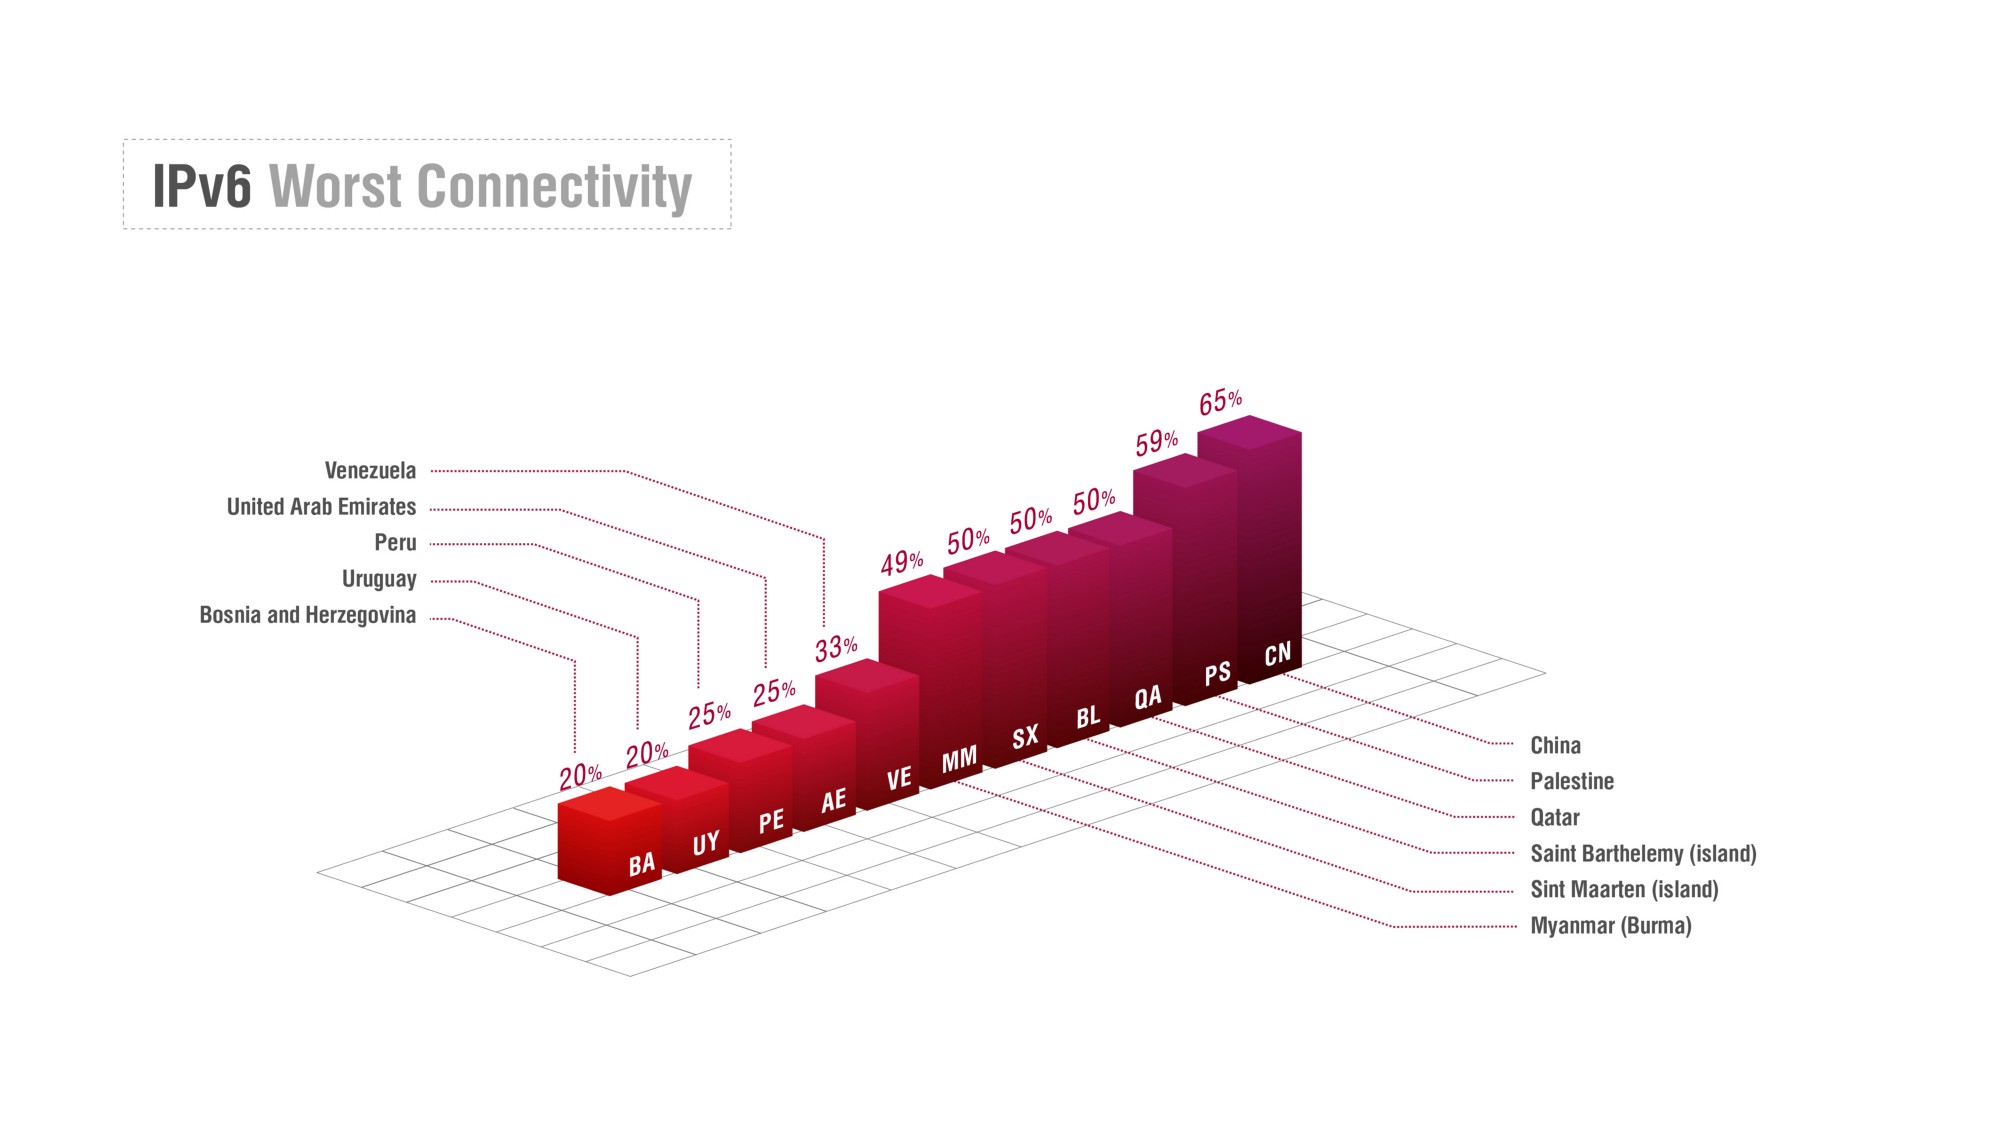
Two former island colonies, Saint Maarten and Saint Barthelemy are understandable compared to the IPv4 rating; microstates, in most cases, depend on only one internet service provider. The other 9 states under 20% and remarkably, the United Arab Emirates with 25% of IPv6 networks connected partially and thus without proper global peering, were big surprises.
Broadband Internet and PTR records
Starting with the question we asked last year — “Does a country’s leading ISP always influence regional reliability more than everyone else?” — we developed additional metric to further investigate the subject. Perhaps the most significant (by user base or customer base) ISP in the area is not necessarily the one that is most critical for overall network connectivity. An example is quickly found with the top country on the list: Germany. Last year it was clear that Germany’s transit was at least 2.29% dependent on the Versatel ISP. This year Versatel is replaced by DTAG (Deutsche Telekom), which improved the country’s stability by 0.03%.
Knowledge of DTAG’s position left us sleepless last year and we tried to develop a metric that would include connections that are sometimes invisible (ASN’s could change ownership or geography, or they could be delisted) in order to show what would actually happen in a state where we know there’s a dominant local player. Russia is the same with Rostelecom, and in the United States, we have the almighty Comcast. They have almost all the broadband user base within their countries; so, what would happen within the region if such provider fails?
After many experiments, we determined that the most accurate indicator is based on analysis of the PTR records. Generally, PTR records are used for Reverse DNS lookup: using the IP-address, it is possible to identify the associated hostname or domain name.
This means that PTR’s could enable measurement of the specific equipment within the IP-address space of an individual provider. Since we already know the largest AS’s for every country in the world, we could count the PTR records within the network of those providers and determine their share of overall PTR records in the region. We should make a disclaimer here: we were counting ONLY PTR records and didn’t calculate the ratio of IP-addresses without PTR records to IP-addresses with PTR records. So, we are speaking strictly of IP-addresses with present PTR records. It is not a general rule to add a PTR record; some providers do this, but some don’t.
We want to show exactly how many of those PTR-enabled IP-addresses would go offline with an outage of the given country’s ASN and what that figure is as a percentage of all the PTR-enabled IP-addresses in the region.
Let’s compare the 20 most reliable countries to the PTR-enabled rating:
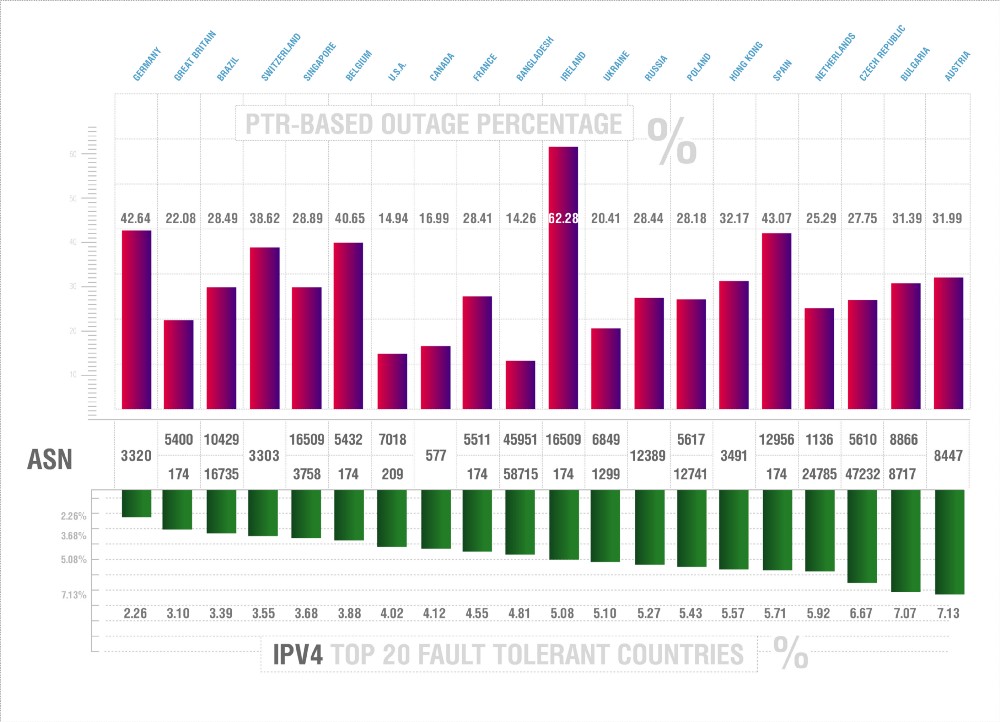
Clearly, the new approach that considers PTR-records presents very different results. In most cases not only does the central region’s AS change, but the percentage is entirely different. In all of the generally reliable (from the global availability point of view) regions, the number of PTR-enabled IP-addresses that shut down following an outage of one autonomous system is dozens of times higher. This could mean that the leading national ISP always handles end-users. Thus, we should assume that this percentage represents the part of the ISP’s user base and customer base that would go offline (if switching to a second internet service provider were not possible) in the event of an outage. From this perspective, countries do not seem as reliable as they appear from the transit point of view. We leave possible conclusions from this PTR-enabled rating to the reader.
Details into Regions
Last year we clearly showed the significant influence of Cogent’s AS 174. This year, with 90% of the rating unchanged compared to last year, when Cogent served such regions as France, Great Britain, United States and Ireland, we see all those countries in the same position with the same upstream issues. The changes that did occur, however, were seen in the United States, where the CenturyLink AS 209 replaced Cogent. In response, Cogent added Spain and Belgium to the list of countries where it represents the dominant worldwide connection medium.
Although this means that Cogent’s shutdown represents a risk to multiple regions, it is also necessary to recognize that this particular ISP’s market position results from its good IPv4 connection. Even though Cogent added 2 countries to its portfolio, its denial of service would not lead to total unavailability in those highly diversified national internet segments.
However, the big news involving Cogent comes from the United States. For two years — 2016 and 2017 — we identified Cogent’s AS 174 as the crucial one for that market. This is no longer the case — in 2018, Cogent has been replaced by the CenturyLink AS 209, and the change sent the United States up the list by three places, to 7th.
Turning to the former USSR region, we see little change from a year ago with the primary internet service provider in Russia remaining Rostelecom (AS 12389), whose market share is quite significant. However, in 2018 Rostelecom’s outage would lead to only 5.27% unavailability, putting Russia in 13th place on the reliability list.
As in last year Russia’s transit market mostly comprises mid-sized Tier-2 networks, resulting in such high availability across the market. The same cannot be said of Uzbekistan, where we observe for the third year in a row a 99.9% dependency on a single AS (28910). Turkmenistan also has just one upstream provider available: Rostelecom. Tajikistan’s index is “way” better with a 78.14% instability index, placing it 202nd on the global reliability list. The fourth country of the region with high instability is Azerbaijan, although its 47% dependency on AS 29049 is not so bad compared to the others.
Ukraine’s fall in the ranking by four places can be explained by the ongoing legislative processes within the country as leaders try to determine the appropriate level of internet regulation to apply. It is not surprising that such interference leads to some loss of reliability, though Ukraine’s position in the top-20 is quite firm.
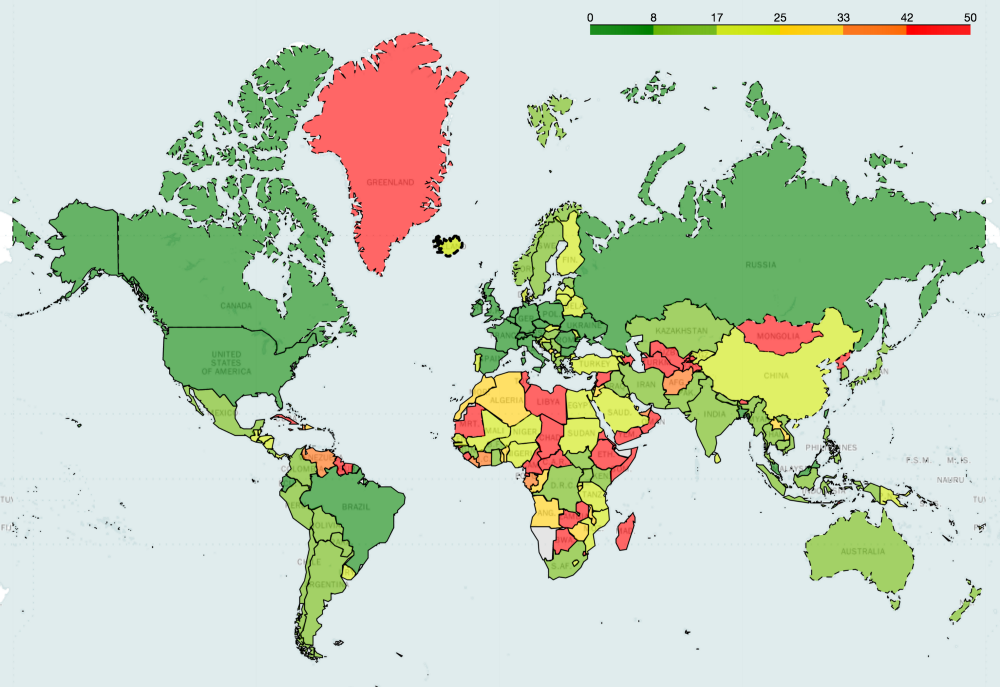
There are “only” 83 countries with over 40% dependency on a single ISP. 65 of those are above 50%. There are 39 usually small countries with instability indices over 90%. There are exceptions though: North Korea’s index is 100% for the AS 131279, which needs no explanation; the same applies to Eritrea, Greenland, and New Caledonia, although the reasons may be different. Ethiopia’s 99% dependency on a single AS 24757 (EthioNet) with a population of 100 million is quite surprising in 2018. Syria is 99.5% dependent on the AS 29256, which is a huge loss from last year’s 88.75% caused by the departure of the German AS that was the market leader. Cuba has an index of 97% with great instability due to its dependence on AS 11960. Jamaica’s index is 91.3% for AS 23520 owned by Columbus Networks, the company we often encounter as the sole provider for microstates in the Americas.
Compared to Luxembourg in 30th place with 9.8% dependency on AS 6661, Monaco has an index of 66% (AS 6758), which is peculiar for a country of such wealth and geography.
The Asian ISP market experienced significant changes during the past two years
Singapore’s improvement in reliability is explained by its position among the Asia’s tigers — the fastest growing economies of the region. The competition is fierce at the top of the reliability list where positions are lost based on single digit percentage changes. Hong Kong and Singapore exchanged places based on an index change of just 2%
According to independent observers we surveyed, Singtel’s position in Singapore is weakening. Last year the most important AS belonged to StarHub, a Singapore broadband provider. In 2018 the main Singapore AS is SingNet’s 3758 (a SingTel broadband subsidiary). We were told that SingTel is undergoing capital shortfalls lately as their business within Singapore isn’t growing (which could be further verified by looking at the stock dynamics for the last two years). SingTel’s difficulties are worsened by the integration process with the Philippines’ ISP Globe — this is probably one more reason SingNet lost customers, thus losing market share and real connections. These events combined to dramatically decentralize the Singapore ISP market, which lead to a jump of 18 places to find itself in 5th place for the current year.
Speaking of the Globe ISP, which owns the AS 4775, last year it was the leading AS for the Philippines, but in 2018 we see that AS 9299 has surpassed it. AS 9299 belongs to PLDT, which is reportedly becoming increasingly aggressive on the Philippine market. In addition, the region’s position is rebounding. The Philippines fell from 20th place in the reliability rating at the end of 2016 to 31st place in 2017 and is now 27th. Clearly, competition is a good thing when speaking about internet reliability in any region. However, we should not forget that Globe represents SingTel and PLDT is an NTT entity in the Philippines.
Hong Kong’s loss in the reliability rating might be tied to PCCW activity in the region. Local observers report that PCCW entered the market aggressively in 2018, gaining market share and active customers in the city.
Last year the main Hong Kong AS belonged to Level3 (AS 3356). With the CenturyLink merger at the end of 2017, Level3 saw its position in Asia change to representing a larger entity, but becoming less stable from the regional perspective.
With the growth of cybersecurity risks and continuous news of attacks on internet infrastructure, it is time for governments, private and public companies, as well as ordinary users to carefully consider their positions. Regional risks need to be studied carefully and honestly by analyzing the true risk and reliability levels. The failover rate could actually be enough to cause real trouble with availability from a massive attack on a big, nation-wide mission-critical service provider, such as the DNS service. Do not forget that the outer world would also be separated from the services and data located within the troubled region in the event of total loss of access.
Our survey clearly shows that ISP markets that are built upon competition develop, in the end, to become much more stable and failure-resistant, in regards to risks from within or outside the surrounding region. Without a competitive market, a single AS failure could lead to network loss for a significant portion of users from a country or even a broader region.