The year 2021 started on such a high note for Qrator Labs: on January 19, our company celebrated its 10th anniversary. Shortly after, in February, our network mitigated quite an impressive 750 Gbps DDoS attack based on old and well known DNS amplification. Furthermore, there is a constant flow of BGP incidents; some are becoming global routing anomalies. We started reporting those in our newly made Twitter account for Qrator.Radar.
Nevertheless, with the first quarter of the year being over, we can take a closer look at DDoS attacks statistics and BGP incidents for January - March 2021.
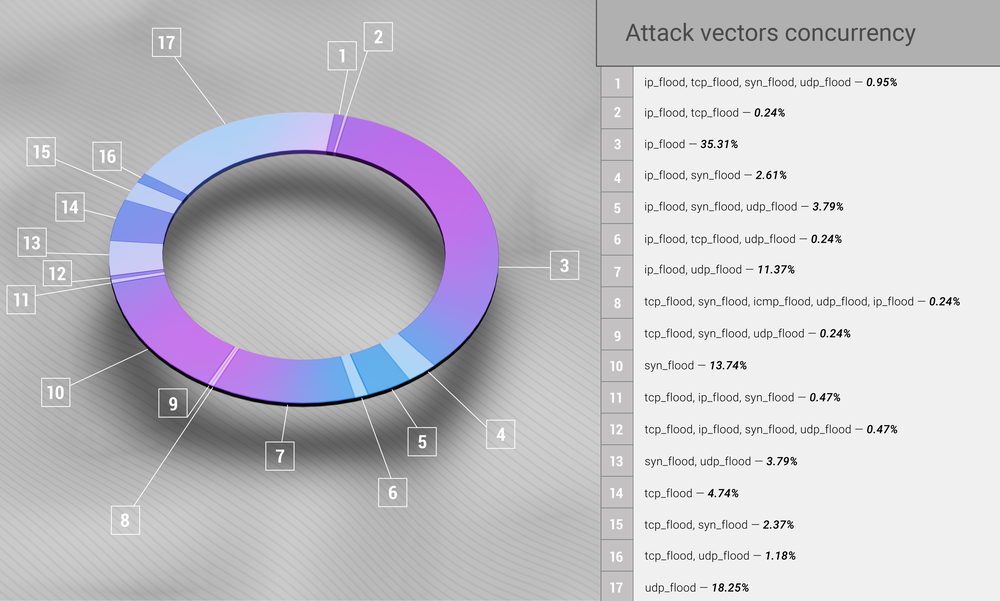
Top-3 DDoS attack vectors in Q1 2021 are IP flood, counting 35.31% of all the attacks; UDP flood with 18.25%; and SYN flood responsible for 13.74% of Q1 attacks. Those separate vectors are now only a tiny fraction away, in terms of attack statistics, from the first mixed combination: IP flood + UDP flood, which in Q1 made 11.37% and took fourth place, effectively outrunning TCP flood in our statistic.
Unmixed vectors count for ~ ⅔ of all the observed attacks during Q1.
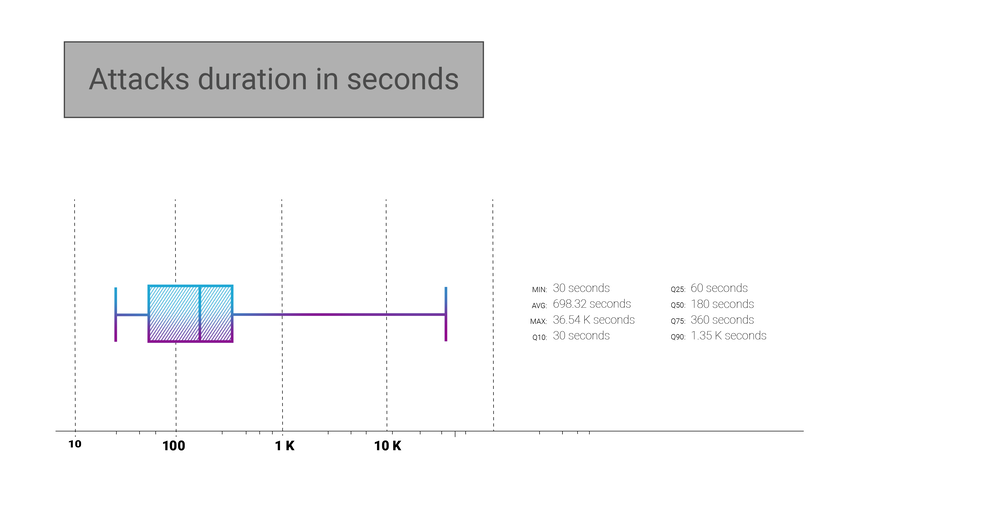
The median attack duration dropped by 40% in Q1 of 2021 compared with the whole year 2020. As we wrote in our annual report, the median attack duration in 2020 was 5 minutes - 300 seconds.
Now we can see that the median attack duration dropped to 3 minutes only. The upper statistics limit of 75 percentile we use except for the maximum duration (which is almost always some exception from the "usual" attack behaviour) is now closer to the previous median - 360 seconds, or 6 minutes, for Q1 2021.
Although it might seem that less than half of attacks is equal to or shorter than 3 minutes, the average attack duration for Q1 2021 is still somewhat over 11 minutes. It is hard to make any sustainable conclusions from that, although we know from experience that shorter attacks are usually "probing" against the target and its defences. When the initial reconnaissance is over, only then attackers flex their computing resources in an attempt to bring the target down, with prolonged attacks at higher bandwidth and packet rate.
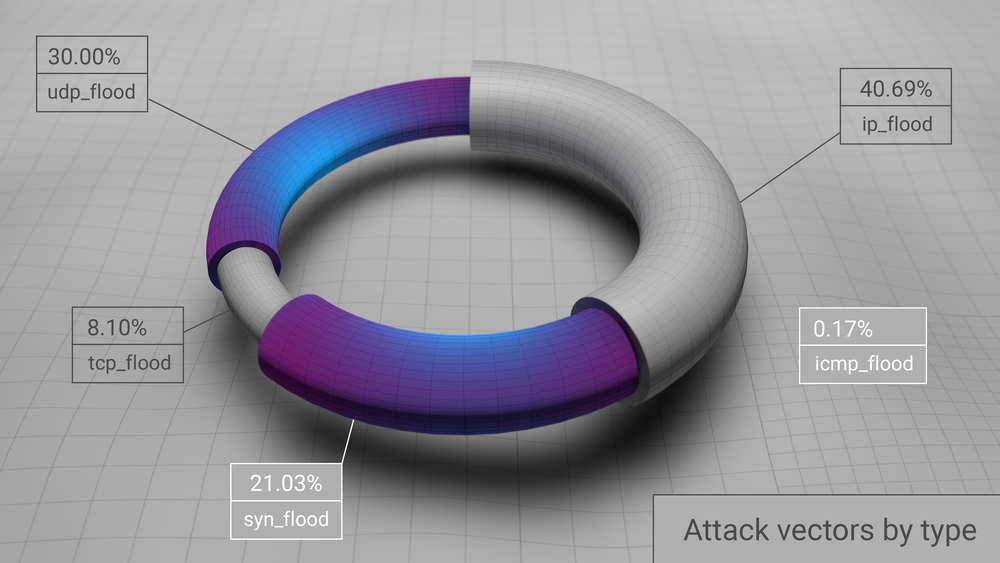
If we compare the Q1 2021 data to that of the year 2020, we immediately see the changing leader in attack vectors - for Q1 IP flood rules the ball with a 40% share, UDP flood in the second place with 30%. For the full 2020, there was a close tie and reverse first and second positions. That is interesting because attacking methods evolve all the time, and this distribution helps us understand where the momentum is headed.
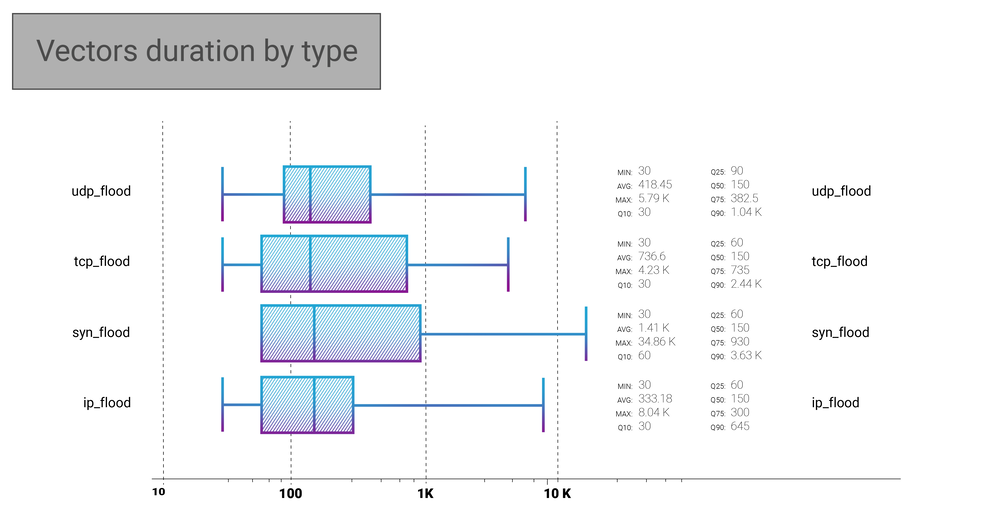
One of the peculiarities in the Q1 data is that the median duration of all the vectors coincides - 150 seconds. We looked deeper into the matter, and it seems that it is just a coincidence that it occurred only in Q1 2021. Other than that, the maximum duration is always interesting to look at, most often representing the stubbornness of some DDoS attacks organizers. The Q1 longest-lasting attack continued for 34860 seconds, or 581 minutes, or, as you already calculated, almost 10 hours of SYN flood.
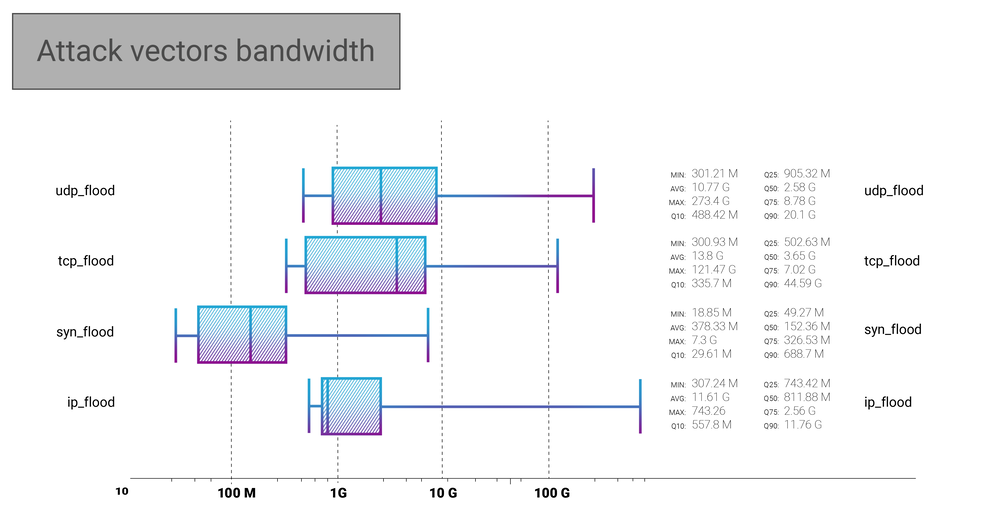
Here, in the IP flood, we can see the particular attack of 750 Gbps bandwidth we mitigated in February. Although, it is evident that it does not affect the median and average numbers, which are still somewhere else. We were interested in how the average bandwidth changes from Q4 2020 to Q1 2021, so we have made an additional slice of data that indicates the following:
Average bandwidth of all DDoS attacks we mitigated during Q4, 2020: 4.47 Gbps.
Average bandwidth of all DDoS attacks we mitigated during Q1, 2021: 9.15 Gbps.
That is more than a 2x jump in average bandwidth! Still remember the 40% shortening of the median DDoS attack duration? Well, here is the proof that there is a trend towards shorter bursts of overwhelming attacking bandwidth.
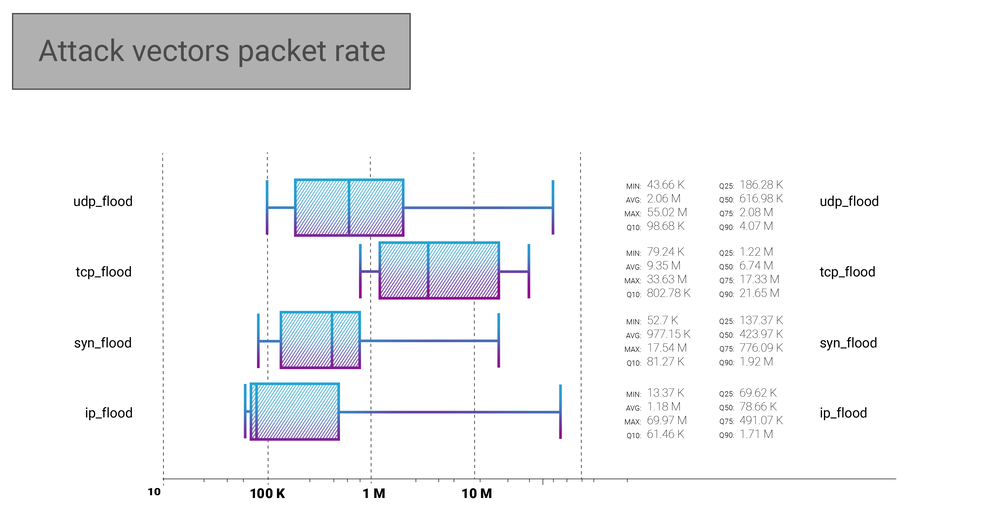
On the packet rate side, it is evident that the average TCP flood intensity is almost 4x higher than that of UDP flood and approximately 8 times higher than the average IP fragments flood. Moreover, on the median, the difference is even more evident.
The already mentioned February DNS amplification DDoS attack could be seen as a maximum packet rate in the IP flood - almost 70 MPPS.
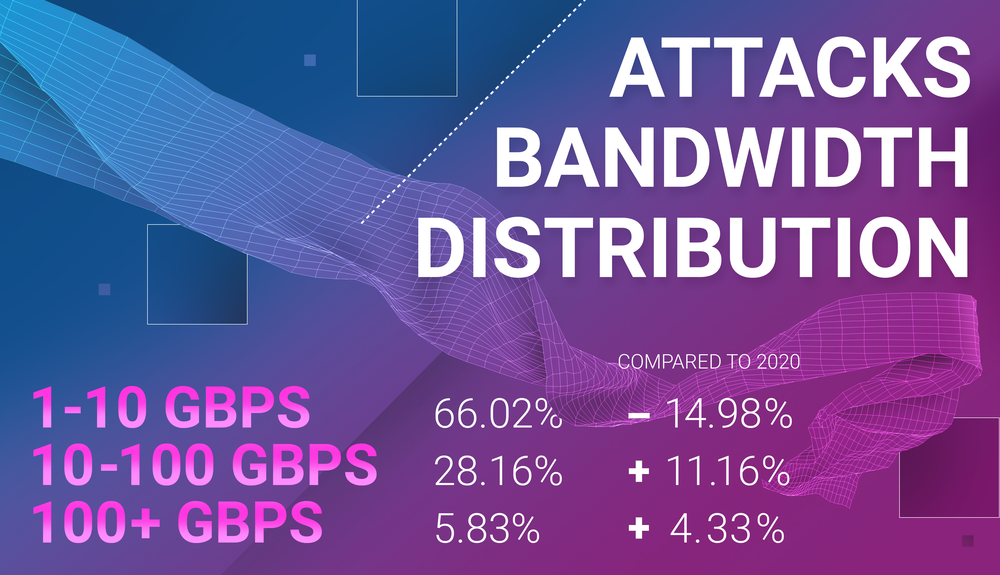
Here the massive shift in attack bandwidth distribution is also evident - 15% that is now lacking from the lowest interval we measure here were effectively distributed among the higher bandwidth ranges, especially the mid-tier 10-100 Gbps, where soon the majority of DDoS attacks could shift. However, not quite yet, as the below 10 Gbps range still represents ⅔ of all the attacks.
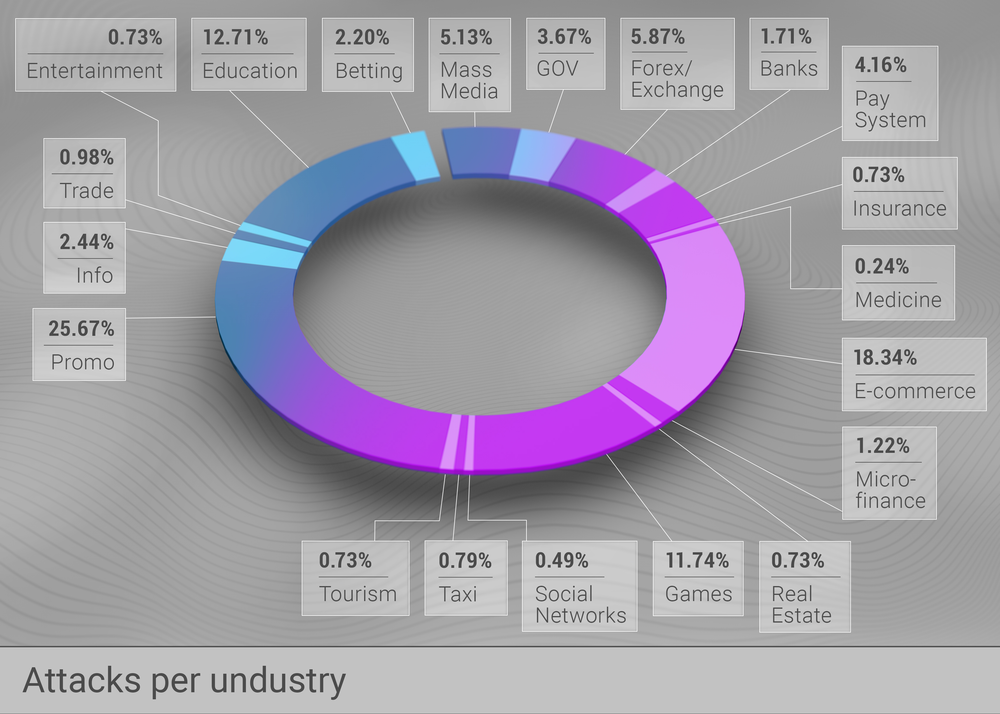
Promo web pages that are targeted with DDoS attacks could effectively represent almost any industry, which is why we usually look past the "Promo" segment, even though it contains ¼ of all the Q1 DDoS attacks. E-commerce (18.34%), Education (12.71%) and Games (11.74%) are the three most frequently attacked industries among our customers. They significantly outpace the rest of businesses in how many attacks are targeted there.


Here we can see a total number of BGP route leaking autonomous systems and BGP hijacking autonomous systems, regardless of the size of an anomaly, during the first quarter of 2021.
From approximately ~100 000 - 110 000 registered ASNs (the discrepancy in the number provided by various RIR databases is probably update related), around 70 000-71 000 advertise at least one prefix (actually, according to some sources, like the CIDR-report, there are around 25 000 ASNs that are announcing only one single prefix), making them visible in the BGP routing tables.
Looking at the number of hijacking autonomous systems, we see right away that this number is comparable with ¼ of all the registered autonomous systems. It is a huge number! Although sometimes hijacks could be traffic engineering measures, most of the time, they are not, and such a significant amount of incidents indicates that the ROA - RPKI movement is there for a reason, not simply fashion.
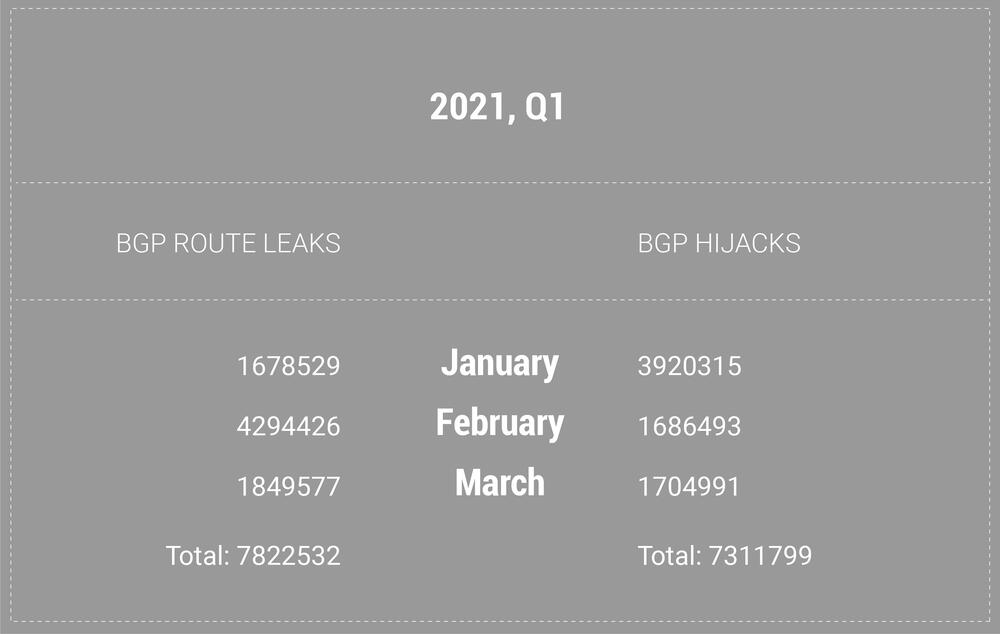
Here we can look at the sum of separate route leaks and hijacks, regardless of their parameters, in Q1 2021. Almost 8 million route leaks and slightly more than 7 million hijacks.
Now, let us take a look at the global incidents that are part of these statistics through each month of the quarter.
Reminder note: Qrator.Radar team has a set of certain thresholds that separate global incidents from the rest. They include affected prefixes, affected autonomous systems, and the incident's distribution among routing tables.
Global BGP Route Leaks:
- January: 4
- February: 2
- March: 3
A detailed description of these incidents could be found according to the occurrence date in Qrator.Radar Twitter feed.
Global BGP Hijacks:
- January: 1
- February: 1
- March: 0
The two most significant incidents were the 20th February massive route leak, which we correlated with the use of "BGP optimization" software, and the April 17 hijack that affected almost 40k prefixes belonging to 4k+ ASNs in 164 countries.
Data sources and observation methodology
Qrator Labs' Quarterly and Annual Reports are based on the data from observed attacks on web pages and servers under the Qrator Labs' DDoS attacks mitigation service and customers insights on the mitigated attacks. The figures and data were collected corresponding to the report's scope timeframe, i.e. either a specific calendar quarter or calendar year.
Each report consists only of the attack data Qrator Labs directly observed ("saw"). Qrator Labs does not collect or analyze traffic outside of its network, meaning that all the conclusions we draw are based solely on the data passing through the Qrator BGP anycast network. By 2021 Qrator Labs anycast network exceeds 3 Tbps of filtering capacity built upon 14 points-of-presence, each connected to a Tier-1 ISP.
Qrator.Radar analyzes BGP paths data collected from more than 800 sessions, serving analytics and real-time incident monitoring to the registered and authenticated owners of Autonomous Systems. Qrator.Radar provides a user with historical data on AS connectivity (links), BGP routing anomalies, and network-related security issues.
Qrator.Radar is the BGP monitoring and analytics tool, as well as the vulnerability scanner for known networks.
That means that when scanning a network, Qrator.Radar analyzes the presence of any known amplificators and the amplification (https://en.wikipedia.org/wiki/Denial-of-service_attack#Amplification) factor itself. This data is further processed to give ISP (or, more precisely, ASN) owners the possibility to analyze the availability of any of those services, which attackers could exploit for DDoS attacks organization.
Such scans are not harmful in any way to the company's hardware or software, Qrator.Radar collects the data only to notify the rightful owners of the network of when and which amplificators became available within the networks they manage. We require authorization of the ASN owners before showing this kind of information we consider sensitive.
Besides the network data and its analysis Qrator Labs also employs open-source intelligence analysis within the public reports. Qrator.Radar, in turn, uses data from publicly available databases to get the IRR, RPKI and geolocation information to correlate between own and open-sourced data.
