Executive summary
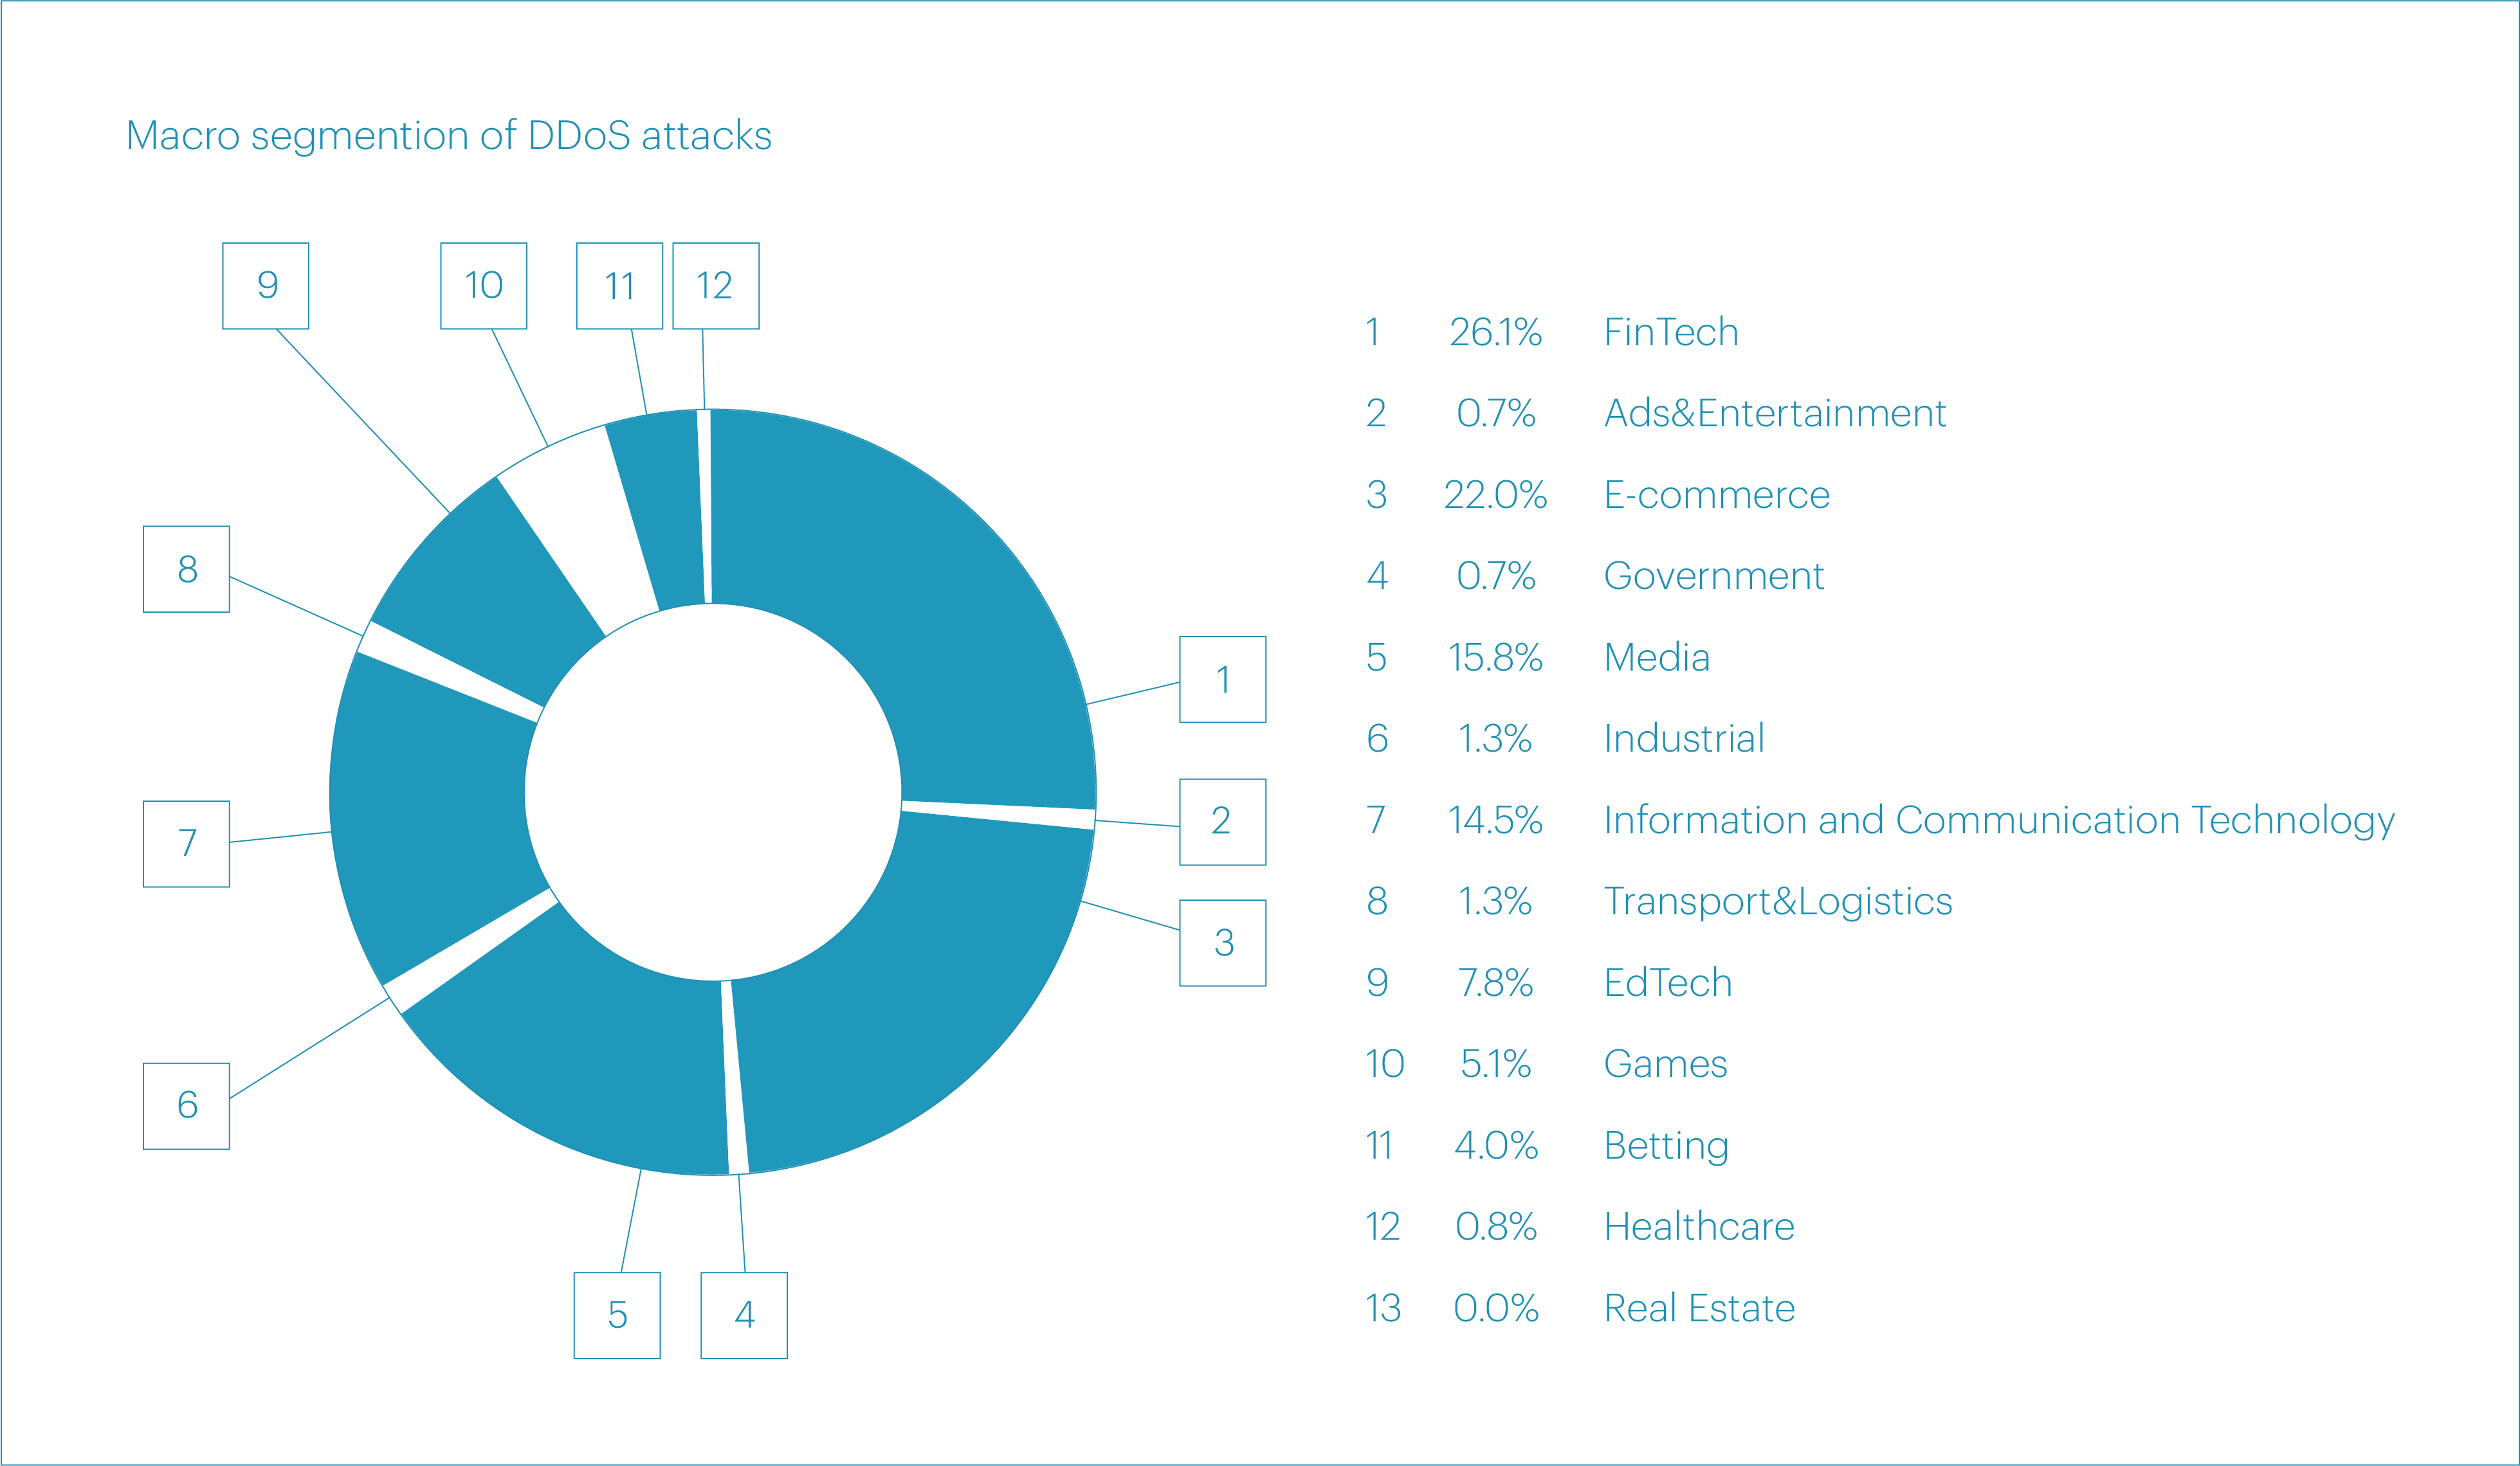
- The largest number of DDoS attacks in Q3 2025 targeted the FinTech (26.1%), E-commerce (22.0%), Media (15.8%), and Information and communication technology (14.5%) segments. Together, these four accounted for nearly 80% of all recorded attacks.
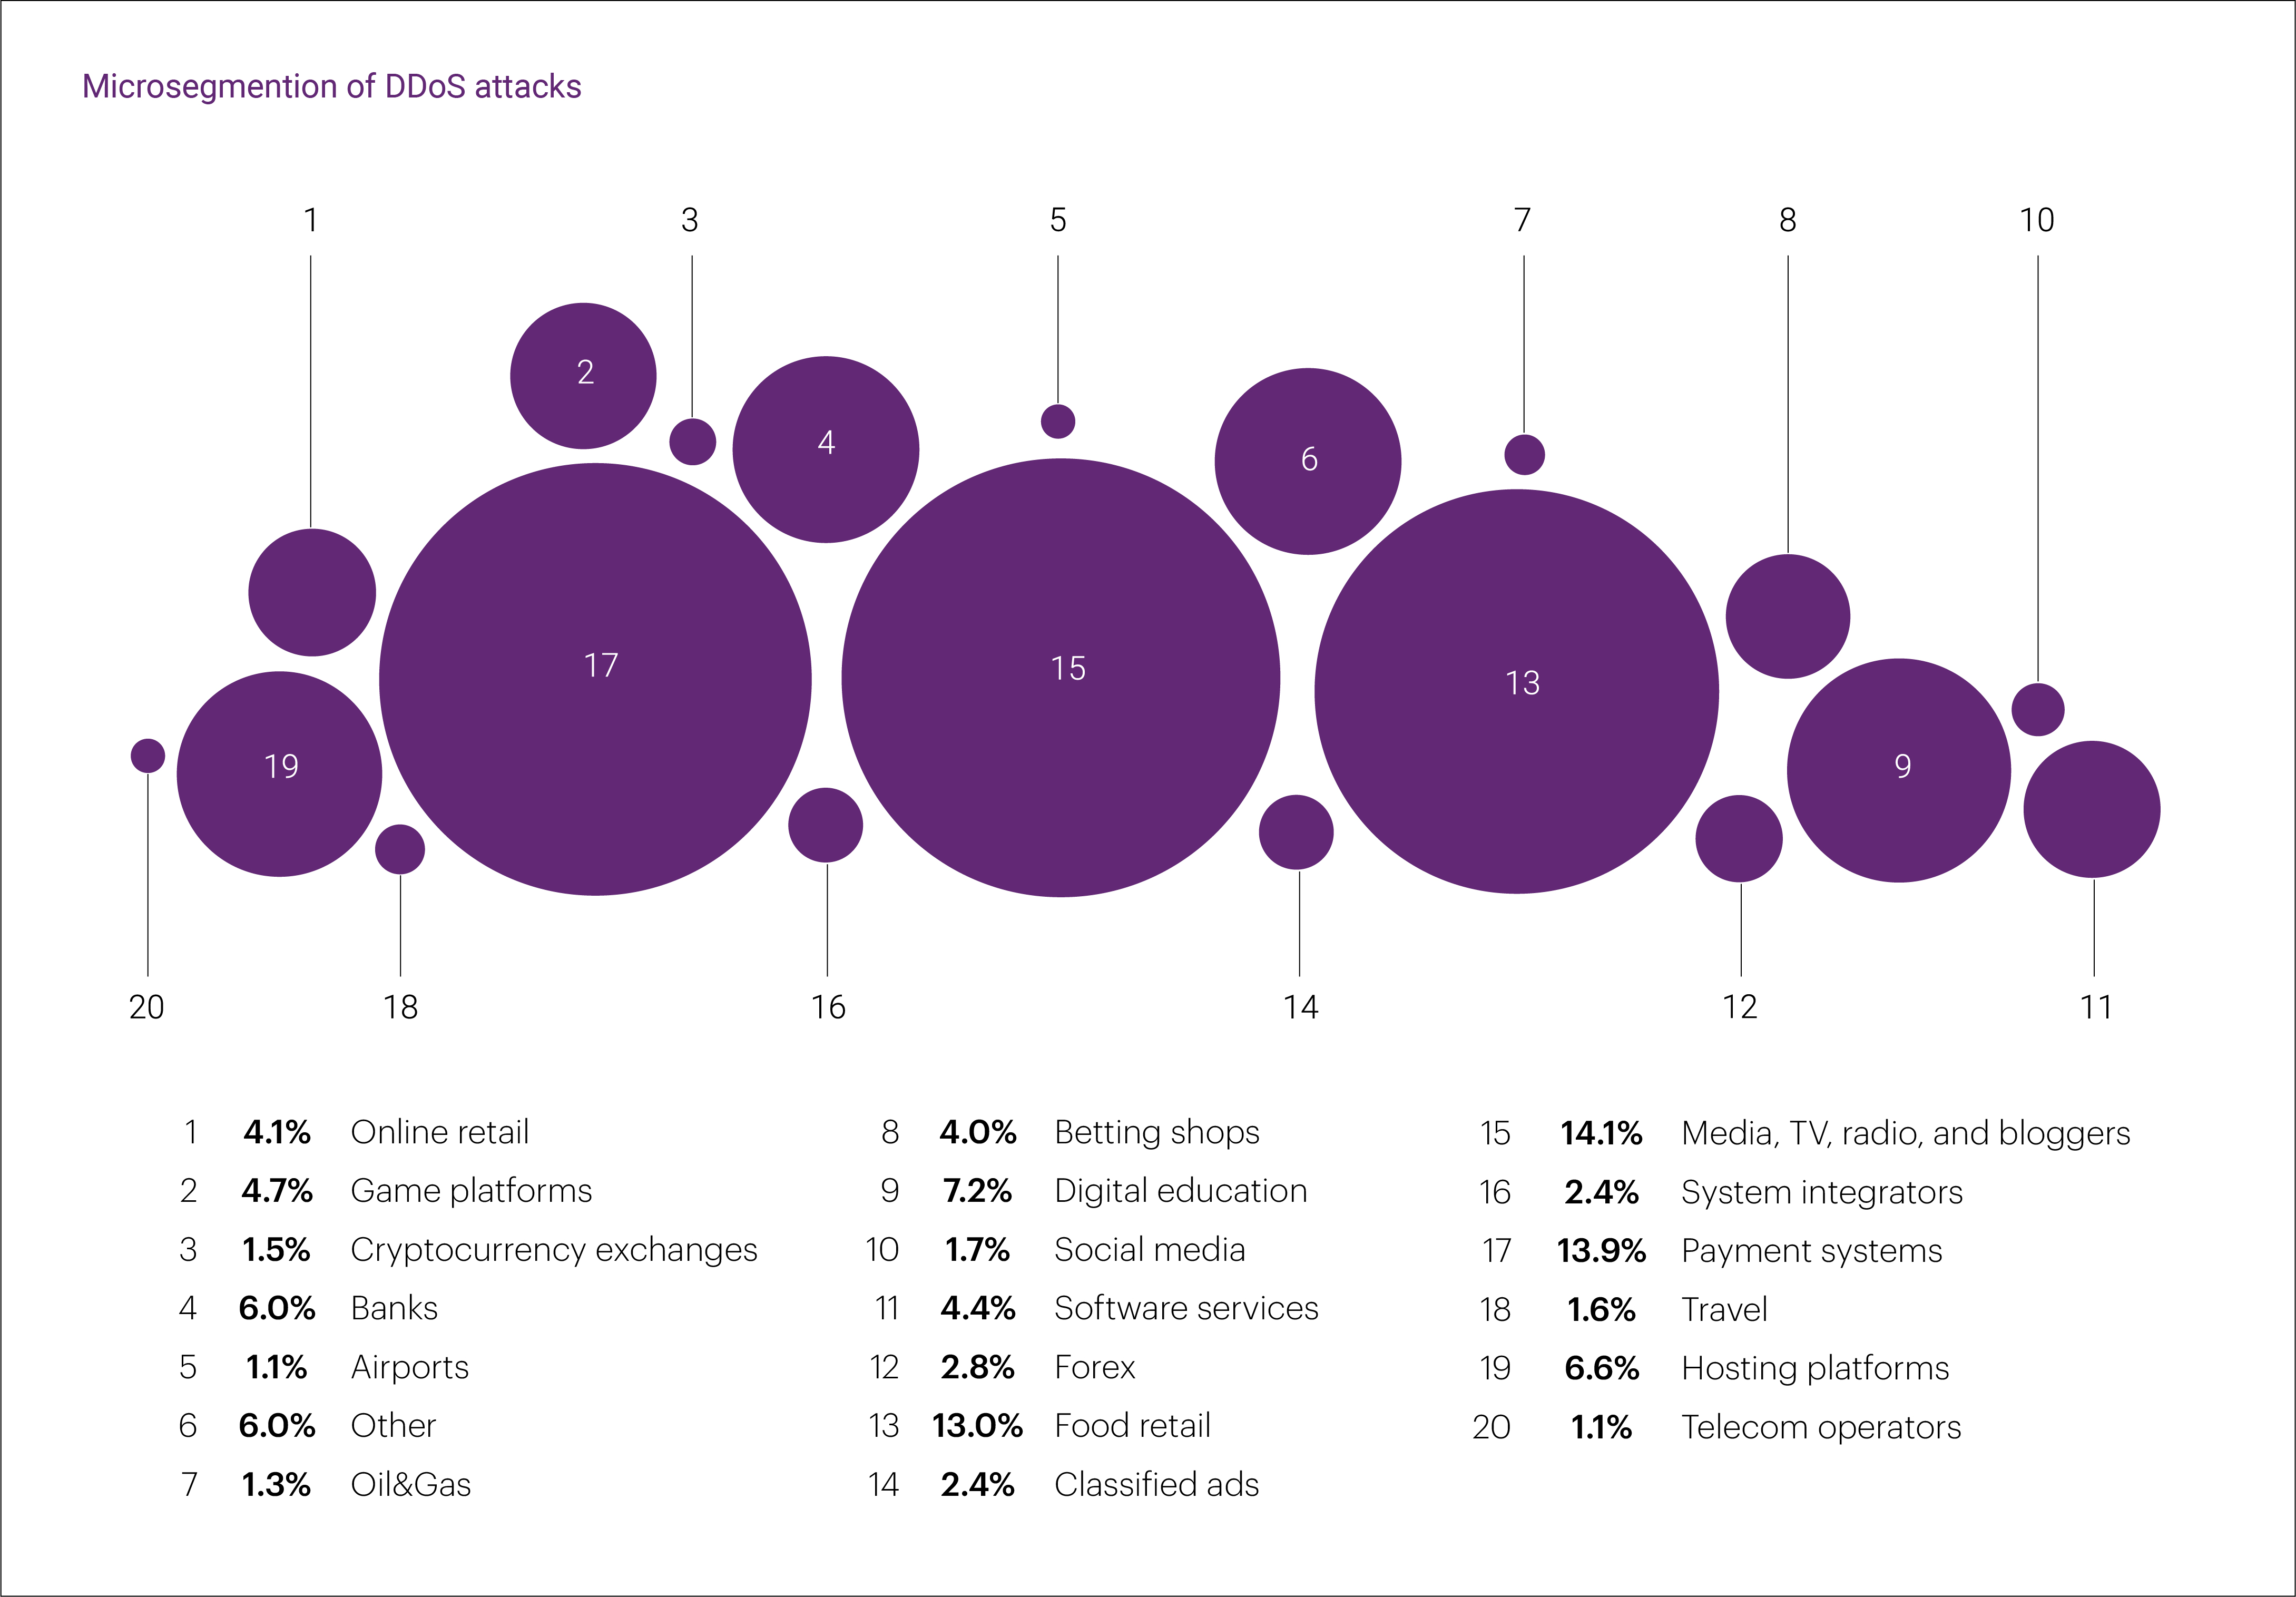
- Among microsegments, the most frequently targeted in Q3 were Media, TV, radio, and bloggers (14.1%), Payment systems (13.9%), Food retail (13.0%), Digital education (7.2%), and Hosting platforms (6.6%).
- The most intensive L3-L4 DDoS attack of Q3 targeted an organization in the Online retail microsegment, reaching a peak bitrate of 1.15 Tbps — slightly higher than the 2024 record of 1.14 Tbps.
- The longest DDoS attack in Q3 lasted more than nine days (225.9 hours). For comparison, the 2024 record was 19 days (463.9 hours).
- In Q3, we recorded another attack launched by a multi-million-device DDoS botnet that we have been tracking for the past six months. This time, the attack involved 5.76 million infected devices, primarily from Brazil, Vietnam, the United States, India, and Argentina.
- In Q3, Brazil became the largest source of L7 DDoS attacks (19%), surpassing Russia (18.4%) and the United States (10.3%).
- We attribute the emergence of such large-scale DDoS botnets and the growing share of developing countries among L7 DDoS sources to the rapid increase in the number of vulnerable devices connected to high-speed Internet and the active use of AI-powered tools by attackers.
- After a sharp increase in bad bot activity in Q2 2025 — mainly driven by a single, exceptionally long-lasting attack — the figures dropped significantly quarter over quarter in Q3 (-37%).
- At the same time, the bot index declined noticeably: the share of bot traffic in the total traffic to protected resources decreased from 2.34% to 1.36%.
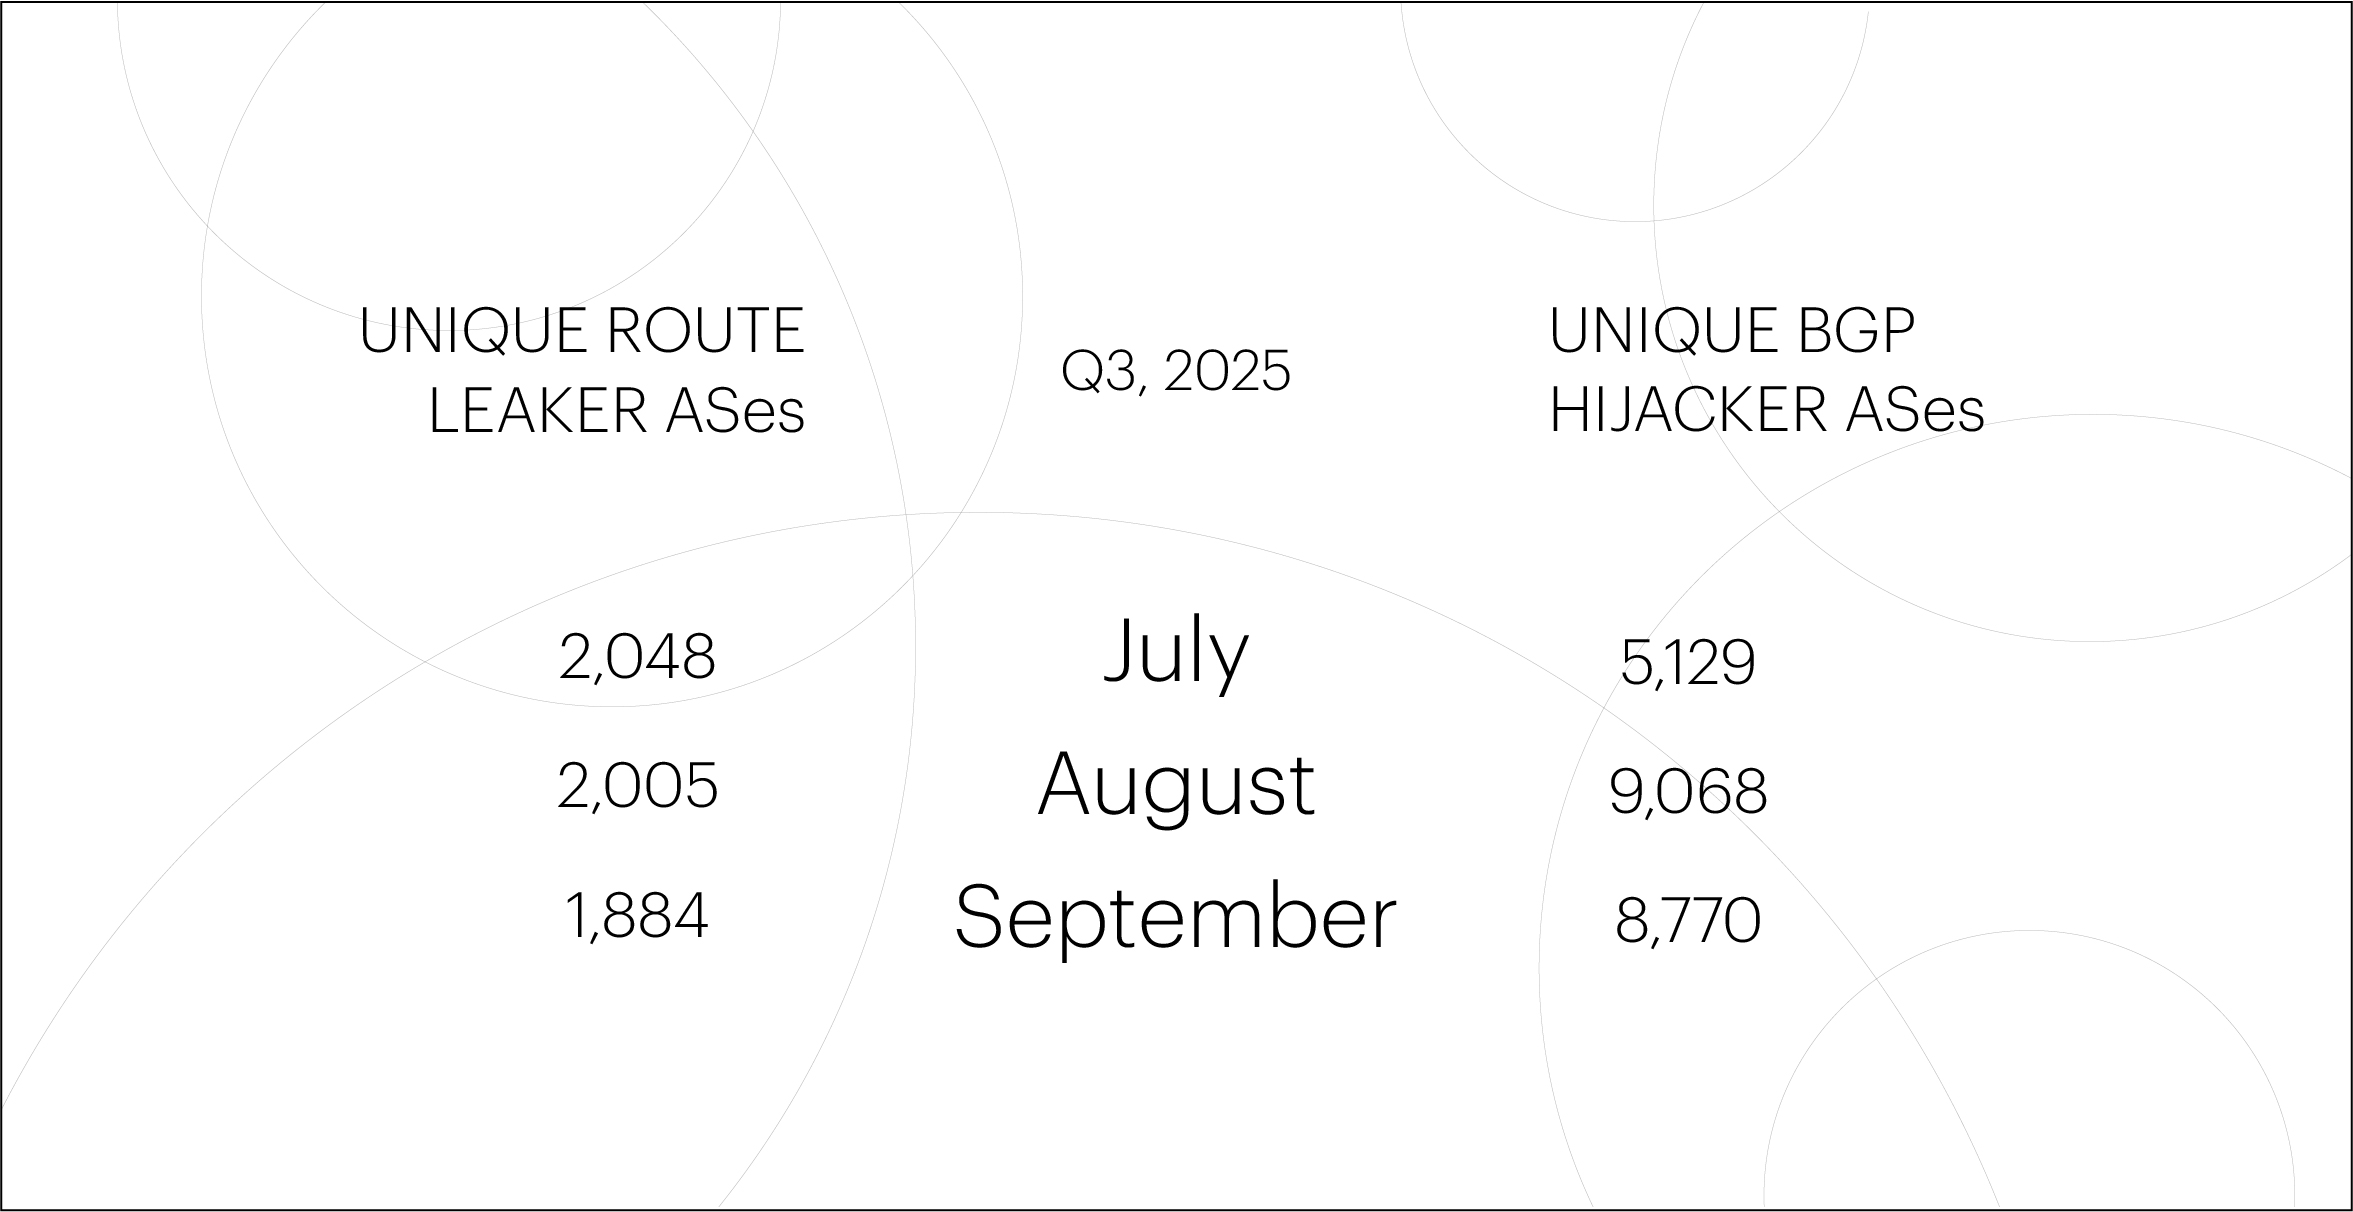
- In Q3 2025, the number of unique ASes responsible for route leaks remained almost unchanged compared to previous periods. However, the number of ASes involved in BGP hijacks was lower than usual due to a noticeable decline in July.
- After a significant increase in Q2 2025, the number of global BGP incidents dropped sharply. In Q3, we recorded only five such incidents — four global route leaks and one global BGP hijack.
Prevalent DDoS attack vectors
Starting from Q3 2025, we have updated our DDoS attack analysis methodology. Until now, we evaluated network- and transport-layer attacks (L3-L4 DDoS) separately from application-layer attacks (L7 DDoS). We are now using a unified approach that analyzes incidents, which may consist of multiple attacks across different vectors.
As before, we exclude L3-L4 DDoS attacks with an intensity below 1 Gbps, considering them background noise. For L7 DDoS attacks, we apply the following criteria: at least 100 blocked IP addresses and a rate of 1,000 requests per second or higher. Separate attack waves are grouped into a single incident if the time gap between them does not exceed one hour.
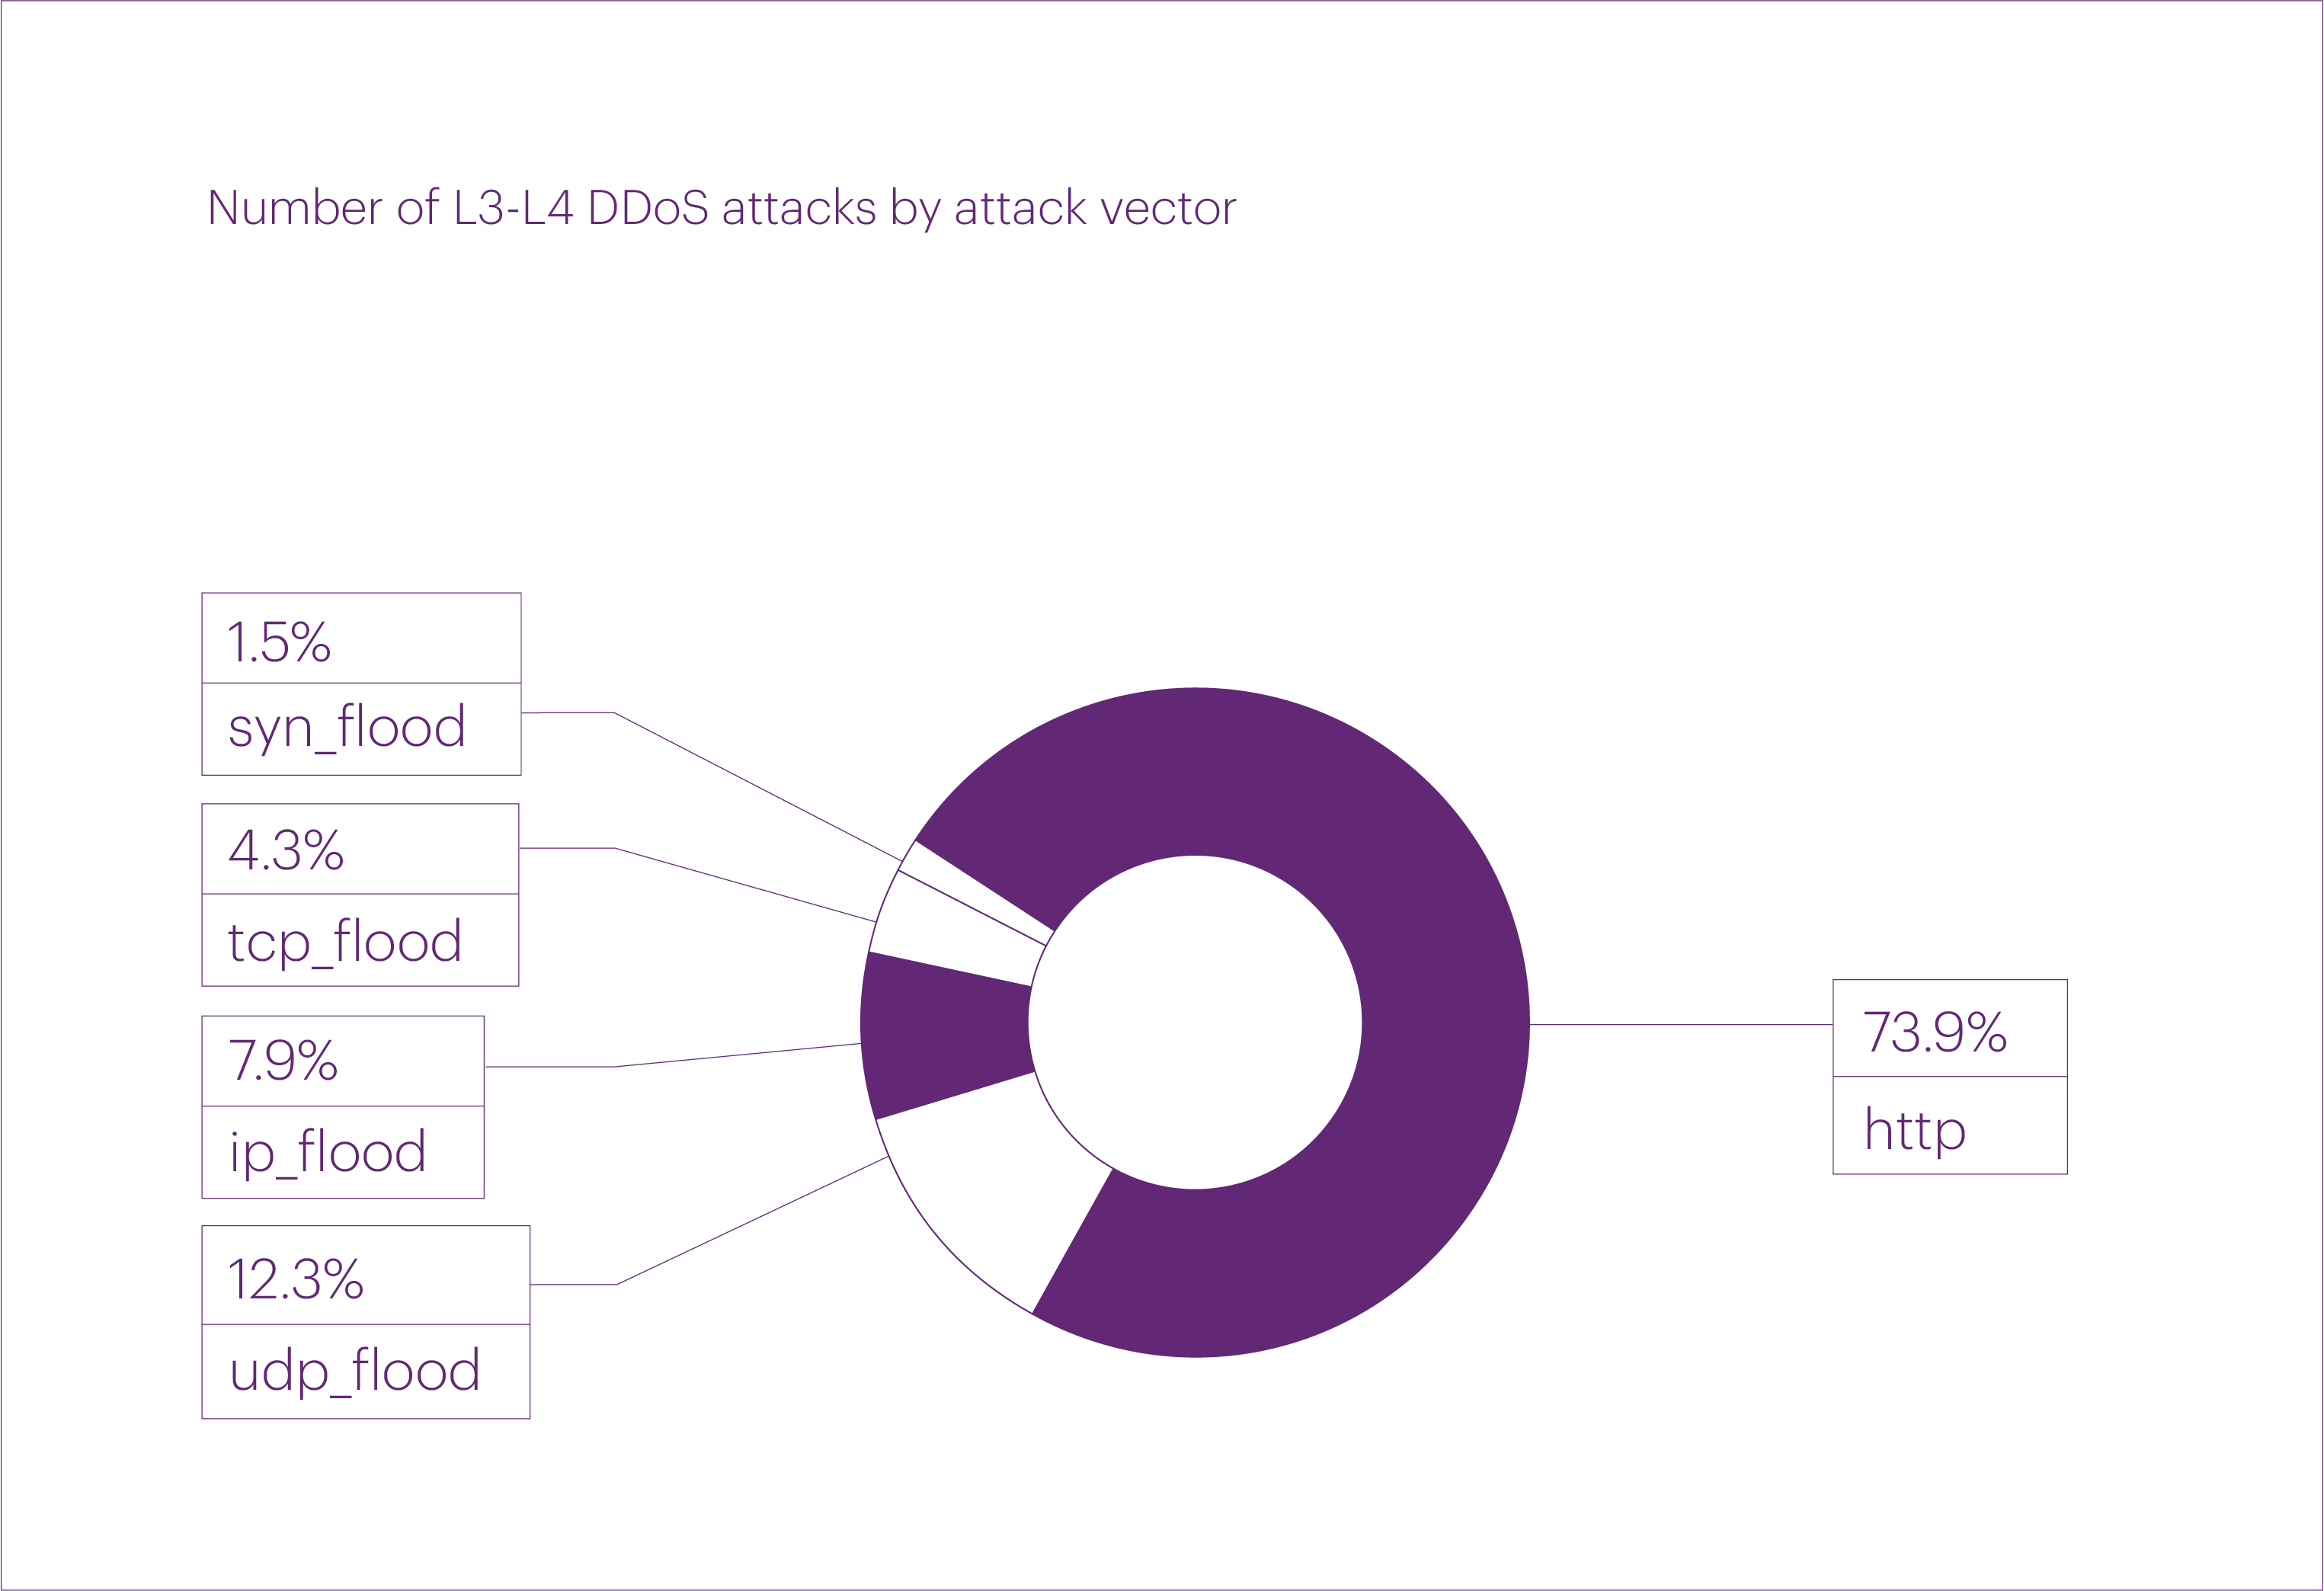
If we look at the pure DDoS attack vectors in Q3, the largest share was accounted for by HTTP — that is, application-layer attacks — which made up 73.9% of all recorded incidents. The second most common was UDP flood with a share of 12.3%, followed by IP flood with 7.9%. Notably, no ICMP flood attacks were recorded throughout Q3.
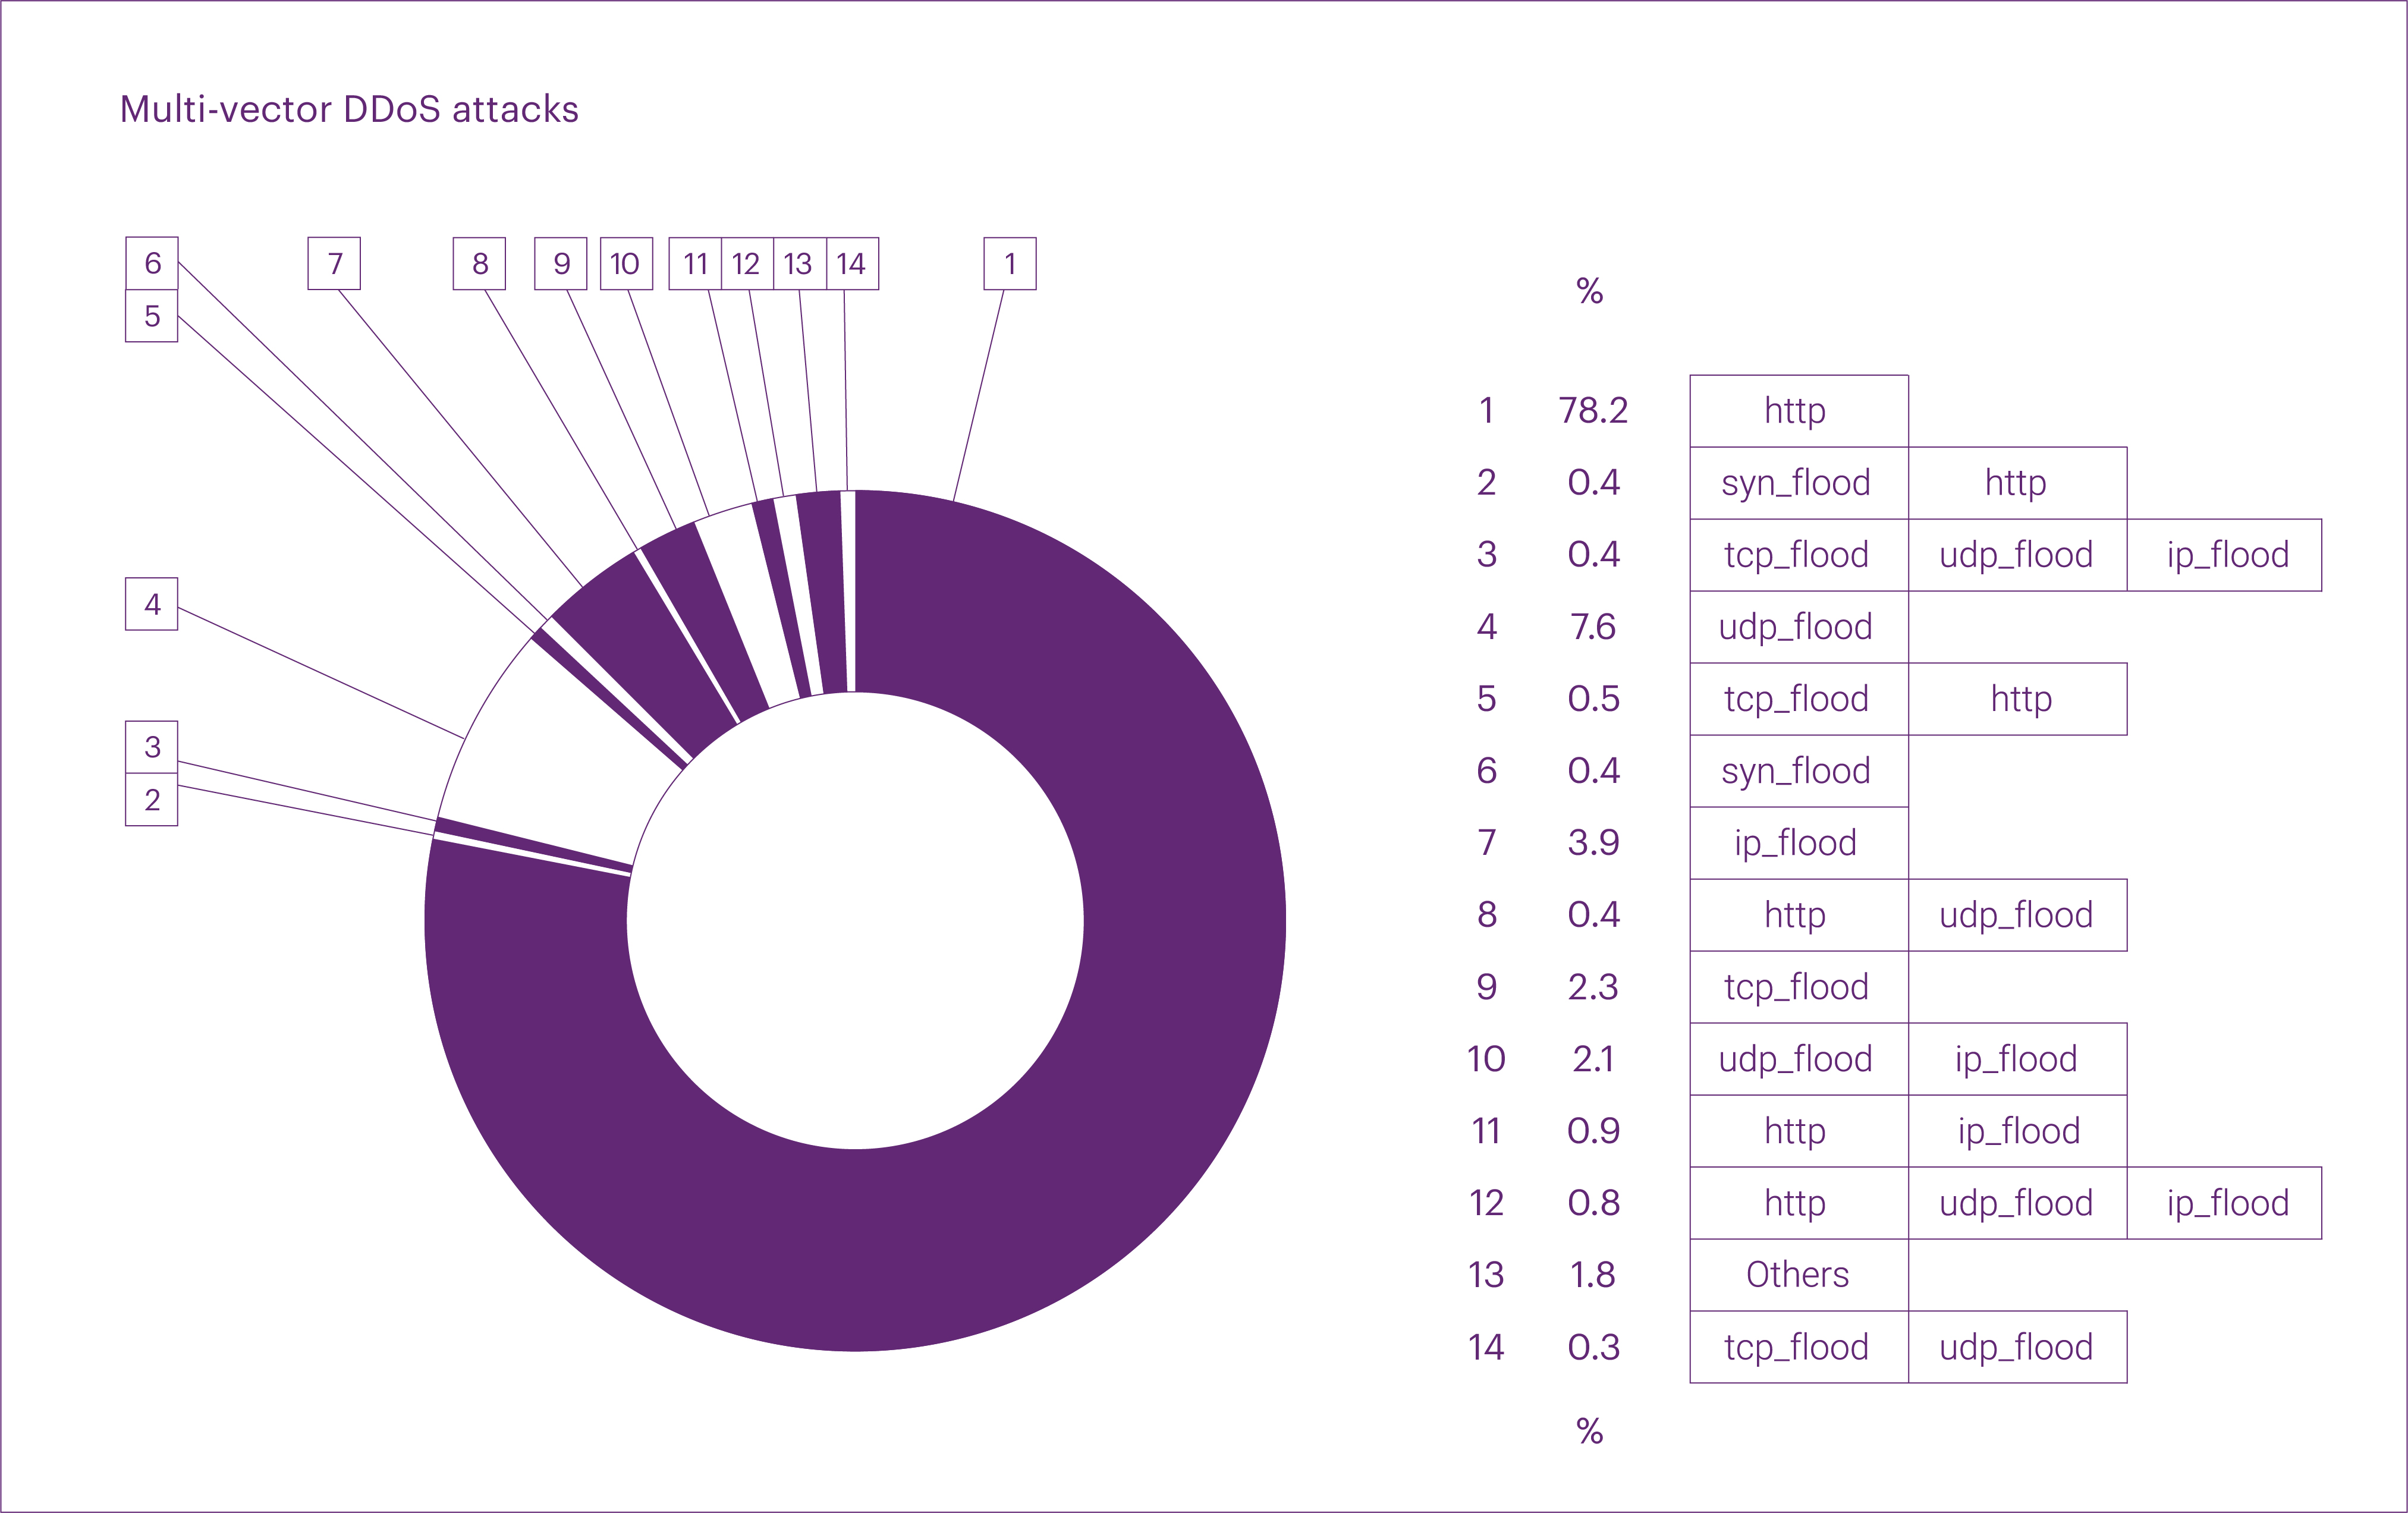
Under the new analysis methodology, multi-vector attacks accounted for 7.5% of all incidents in Q3 2025. About half of them (3.8% of all incidents) combined L3-L4 DDoS with L7 DDoS.
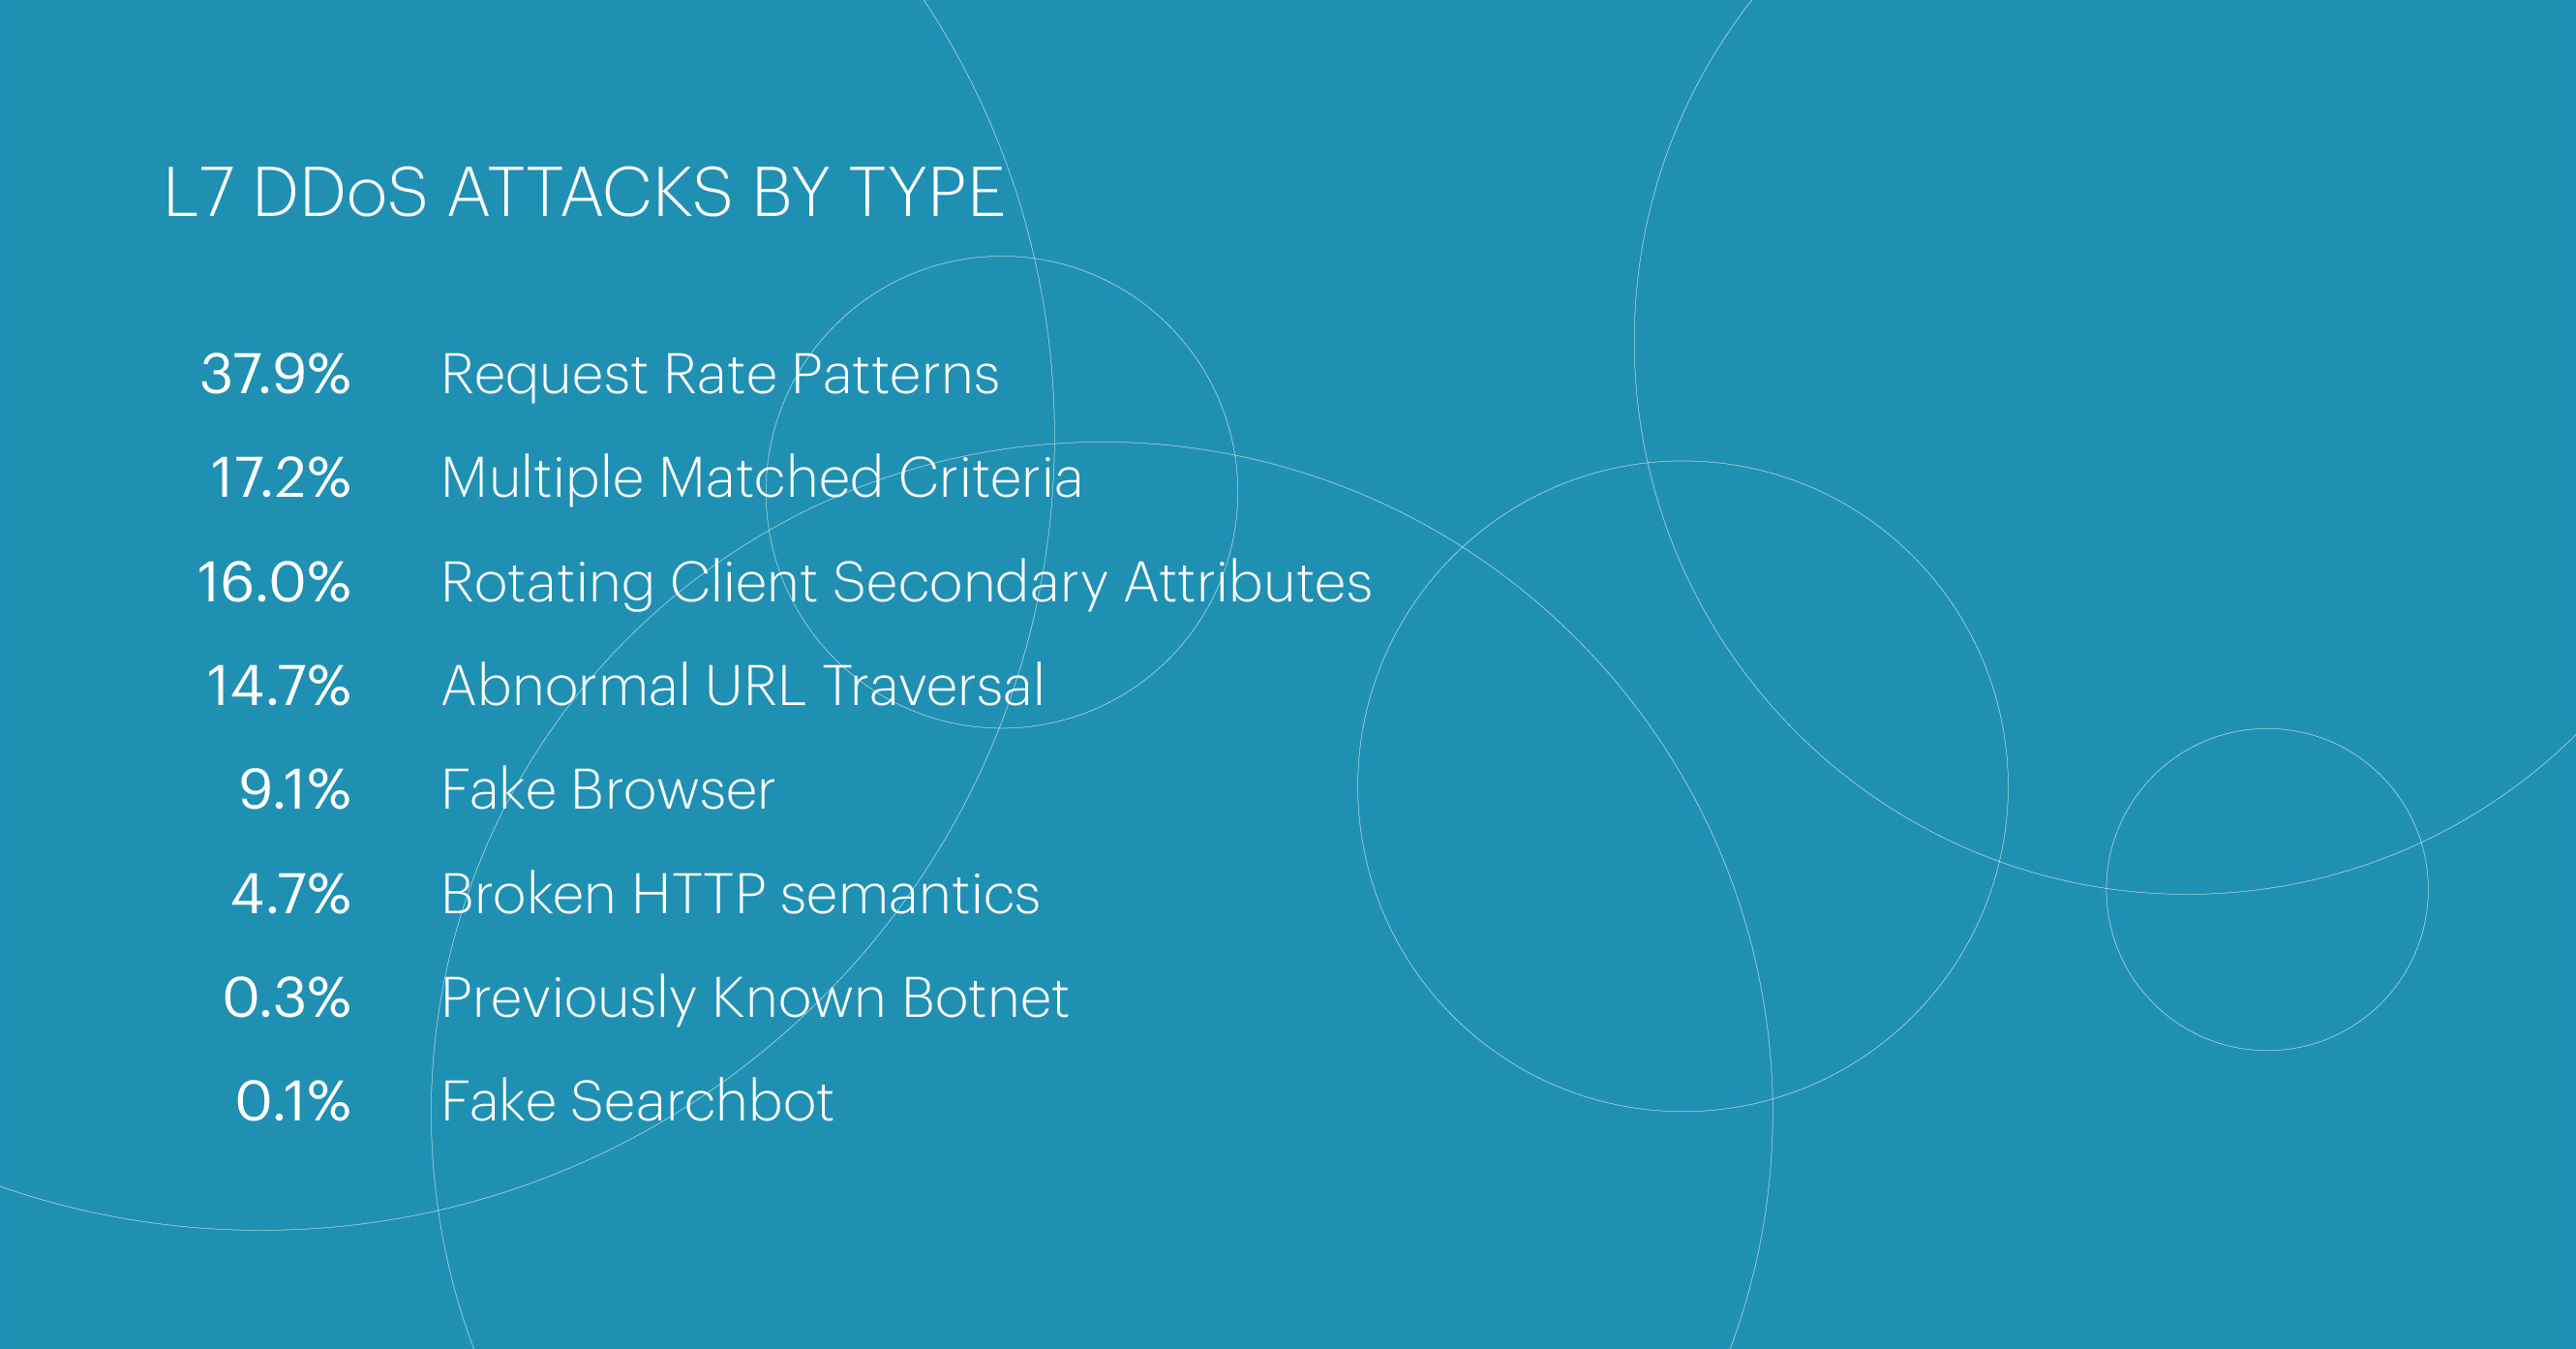
The most common class of L7 DDoS attacks in Q3 was Request Rate Patterns (37.9%), characterized by request frequencies that differ from the expected behavior of legitimate users. The second most common was the multi-class category Multiple Matched Criteria (17.2%), followed by Rotating Client Secondary Attributes (16.0%) — attacks involving unusual sets of request headers.
Duration of DDoS attacks
The longest DDoS attack in Q3 2025 lasted more than nine days (225.9 hours). The second-longest was also notable, lasting 119.2 hours — nearly five days. Finally, the third-longest attack in Q3 was relatively short, lasting less than a day — only 17.7 hours.
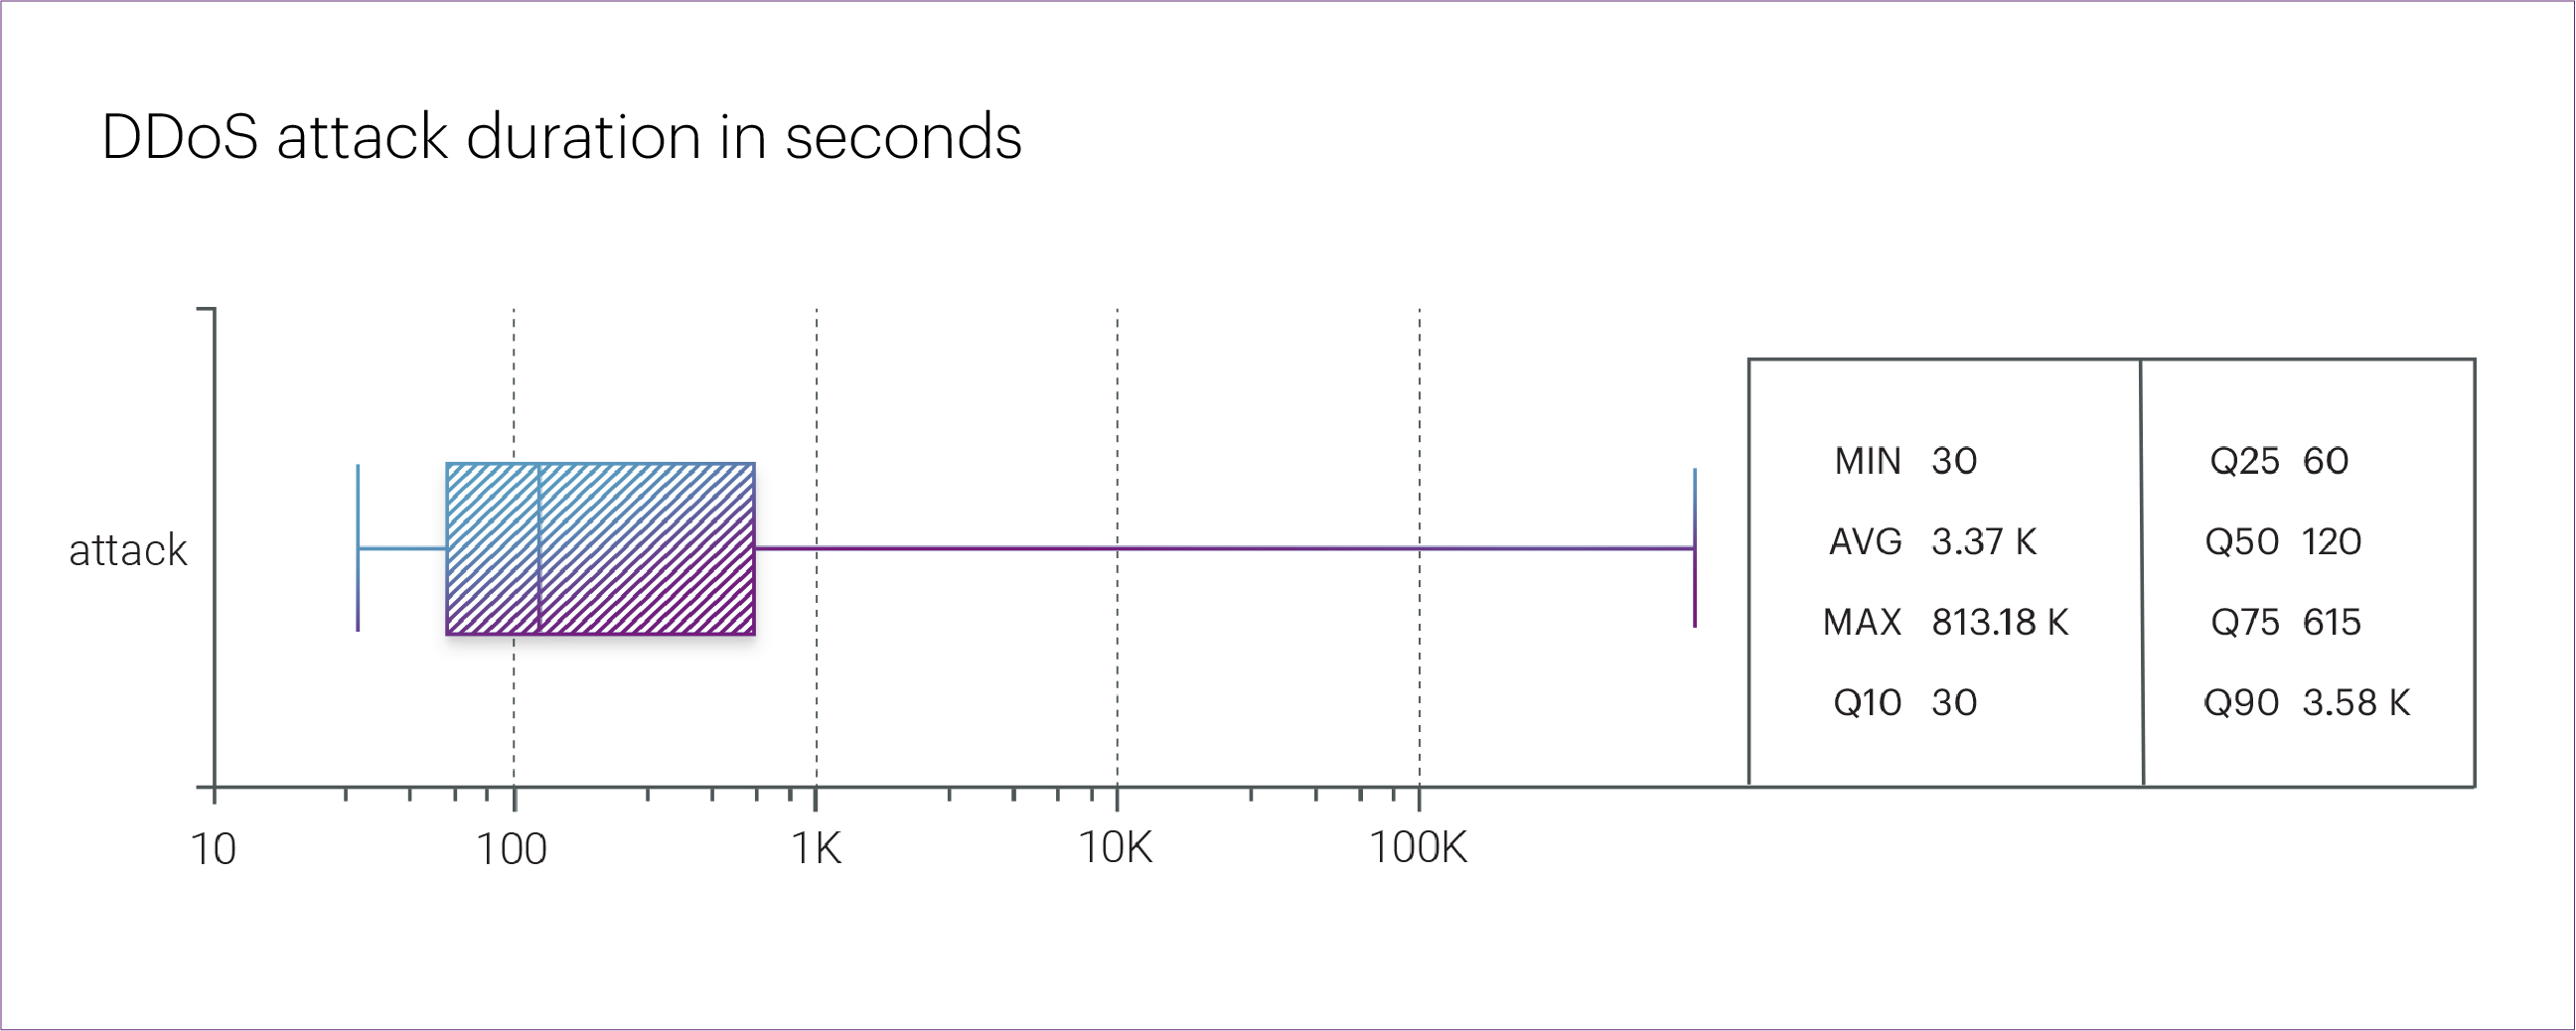
The average attack duration in Q3 was 3,370 seconds (about 56 minutes), while the median duration was only 2 minutes.
Distribution of DDoS attacks across industries
In Q3 2025, DDoS attacks most frequently targeted the FinTech (26.1%), E-commerce (22.0%), Media (15.8%), and Information and communication technology (14.5%) segments. Together, these four accounted for 78.3% of all attacks recorded during the reporting period.
Looking at a more detailed breakdown, the largest number of DDoS attacks in Q3 targeted the following microsegments: Media, TV, radio, and bloggers (14.1%), Payment systems (13.9%), Food retail (13.0%), Digital education (7.2%), and Hosting platforms (6.6%). Combined, these five microsegments represented more than half (54.8%) of all attacks.
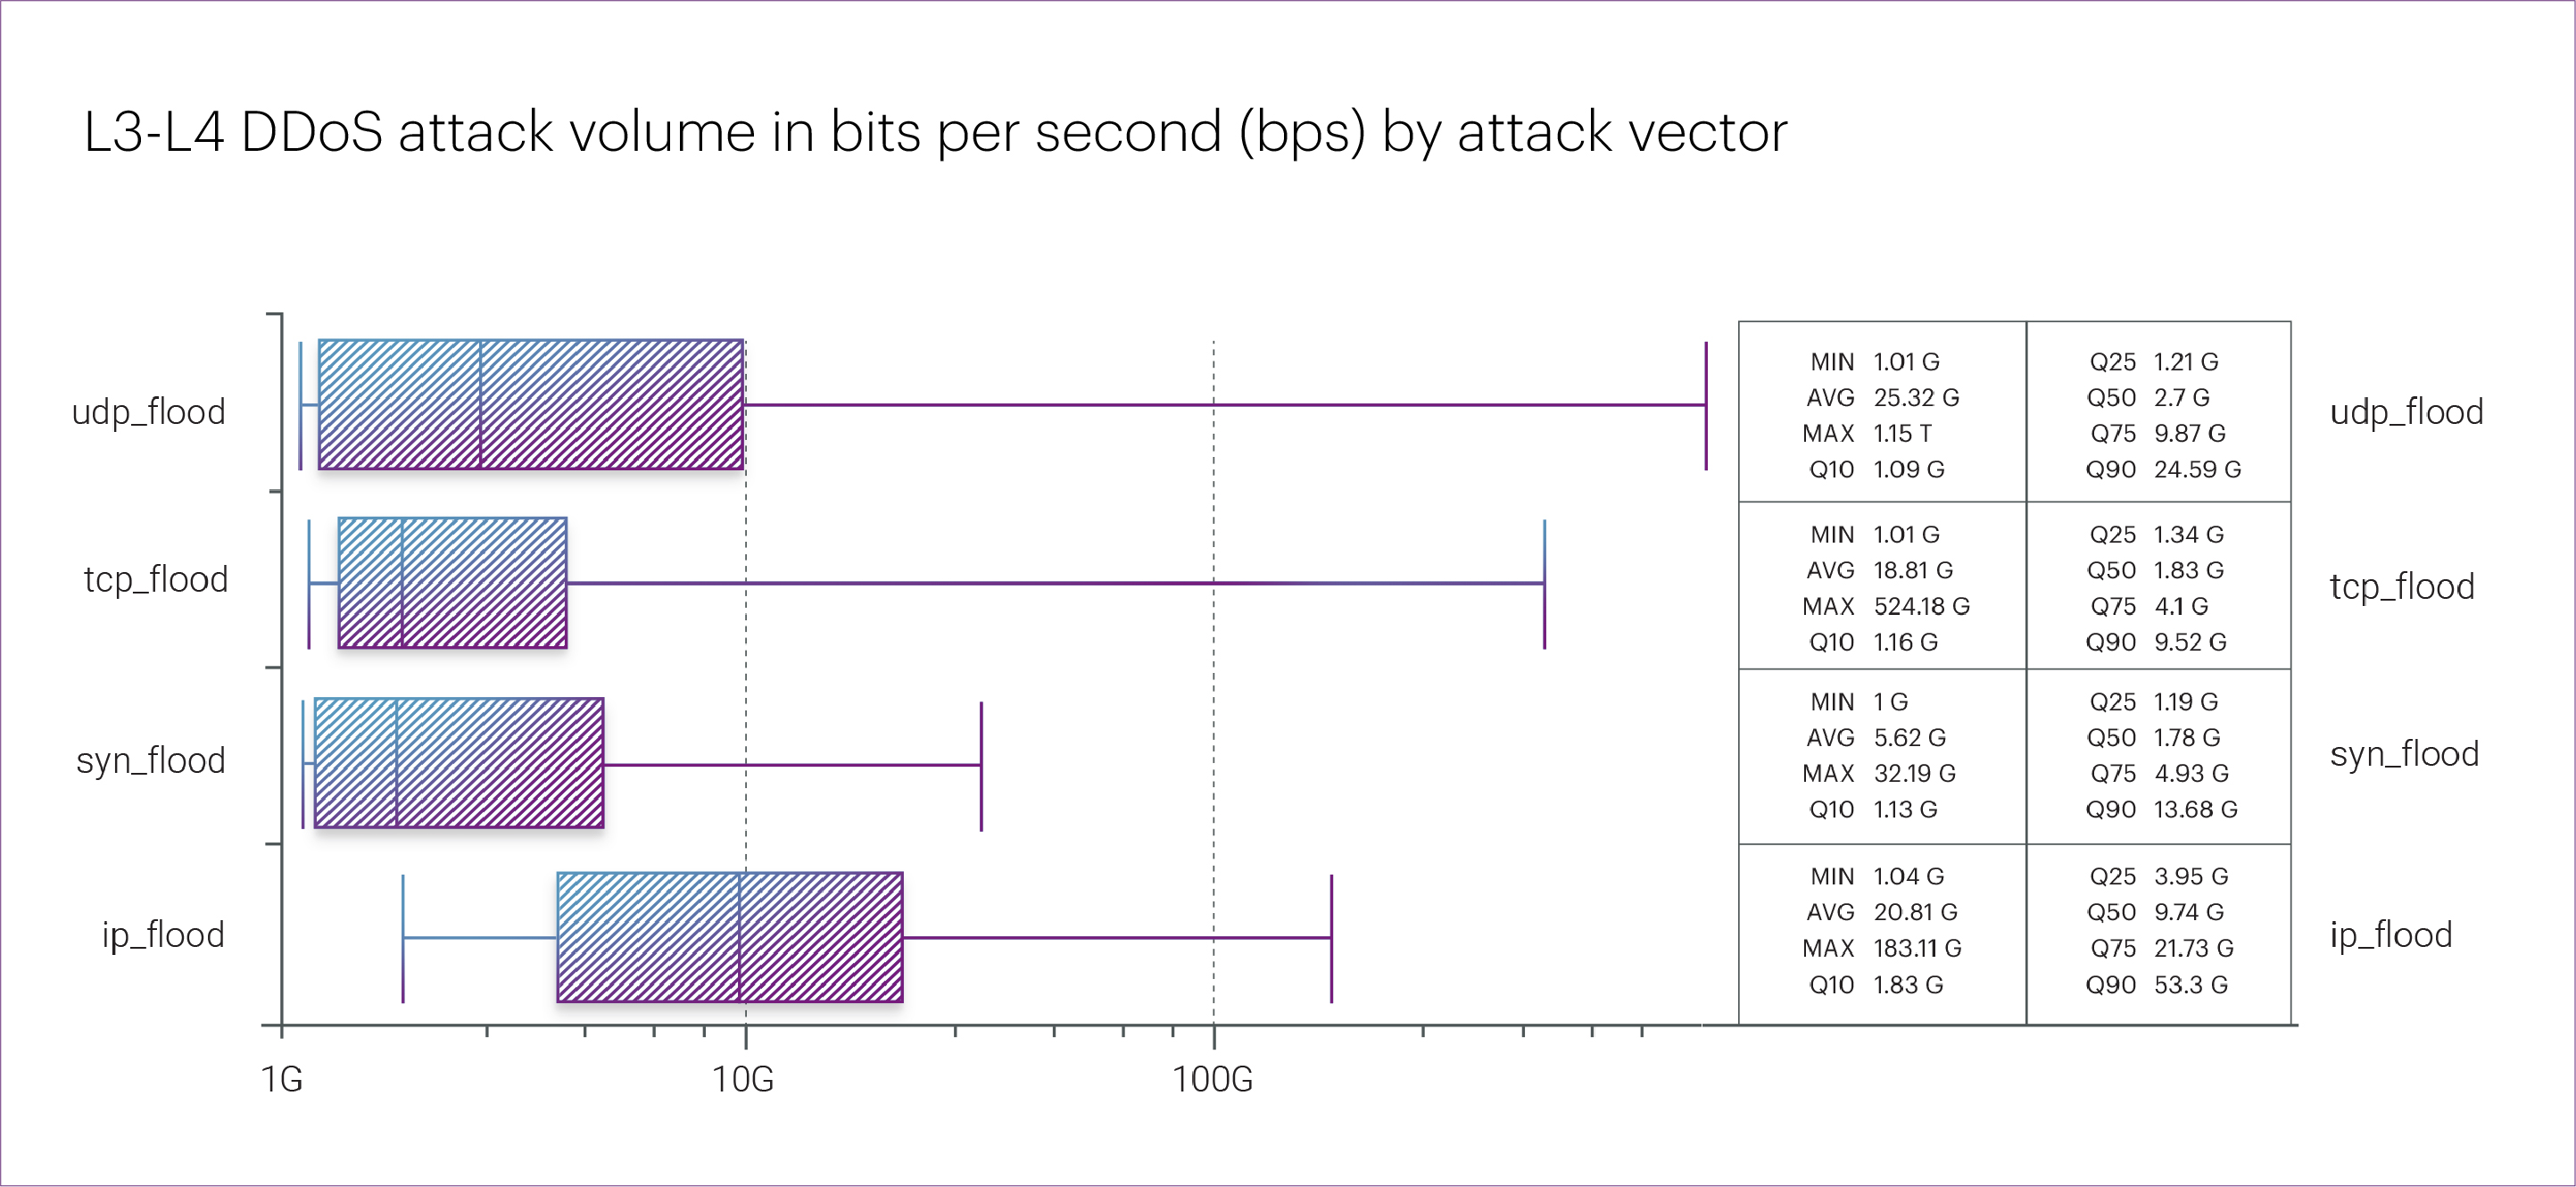
Intensity of L3-L4 DDoS attacks
The most intensive L3-L4 DDoS attack of Q3 2025 occurred on August 27. It targeted an organization in the Online retail segment and lasted only a few minutes. Despite its short duration, the attack reached an exceptional peak of 1.15 Tbps — slightly exceeding the previous year’s record of 1.14 Tbps.
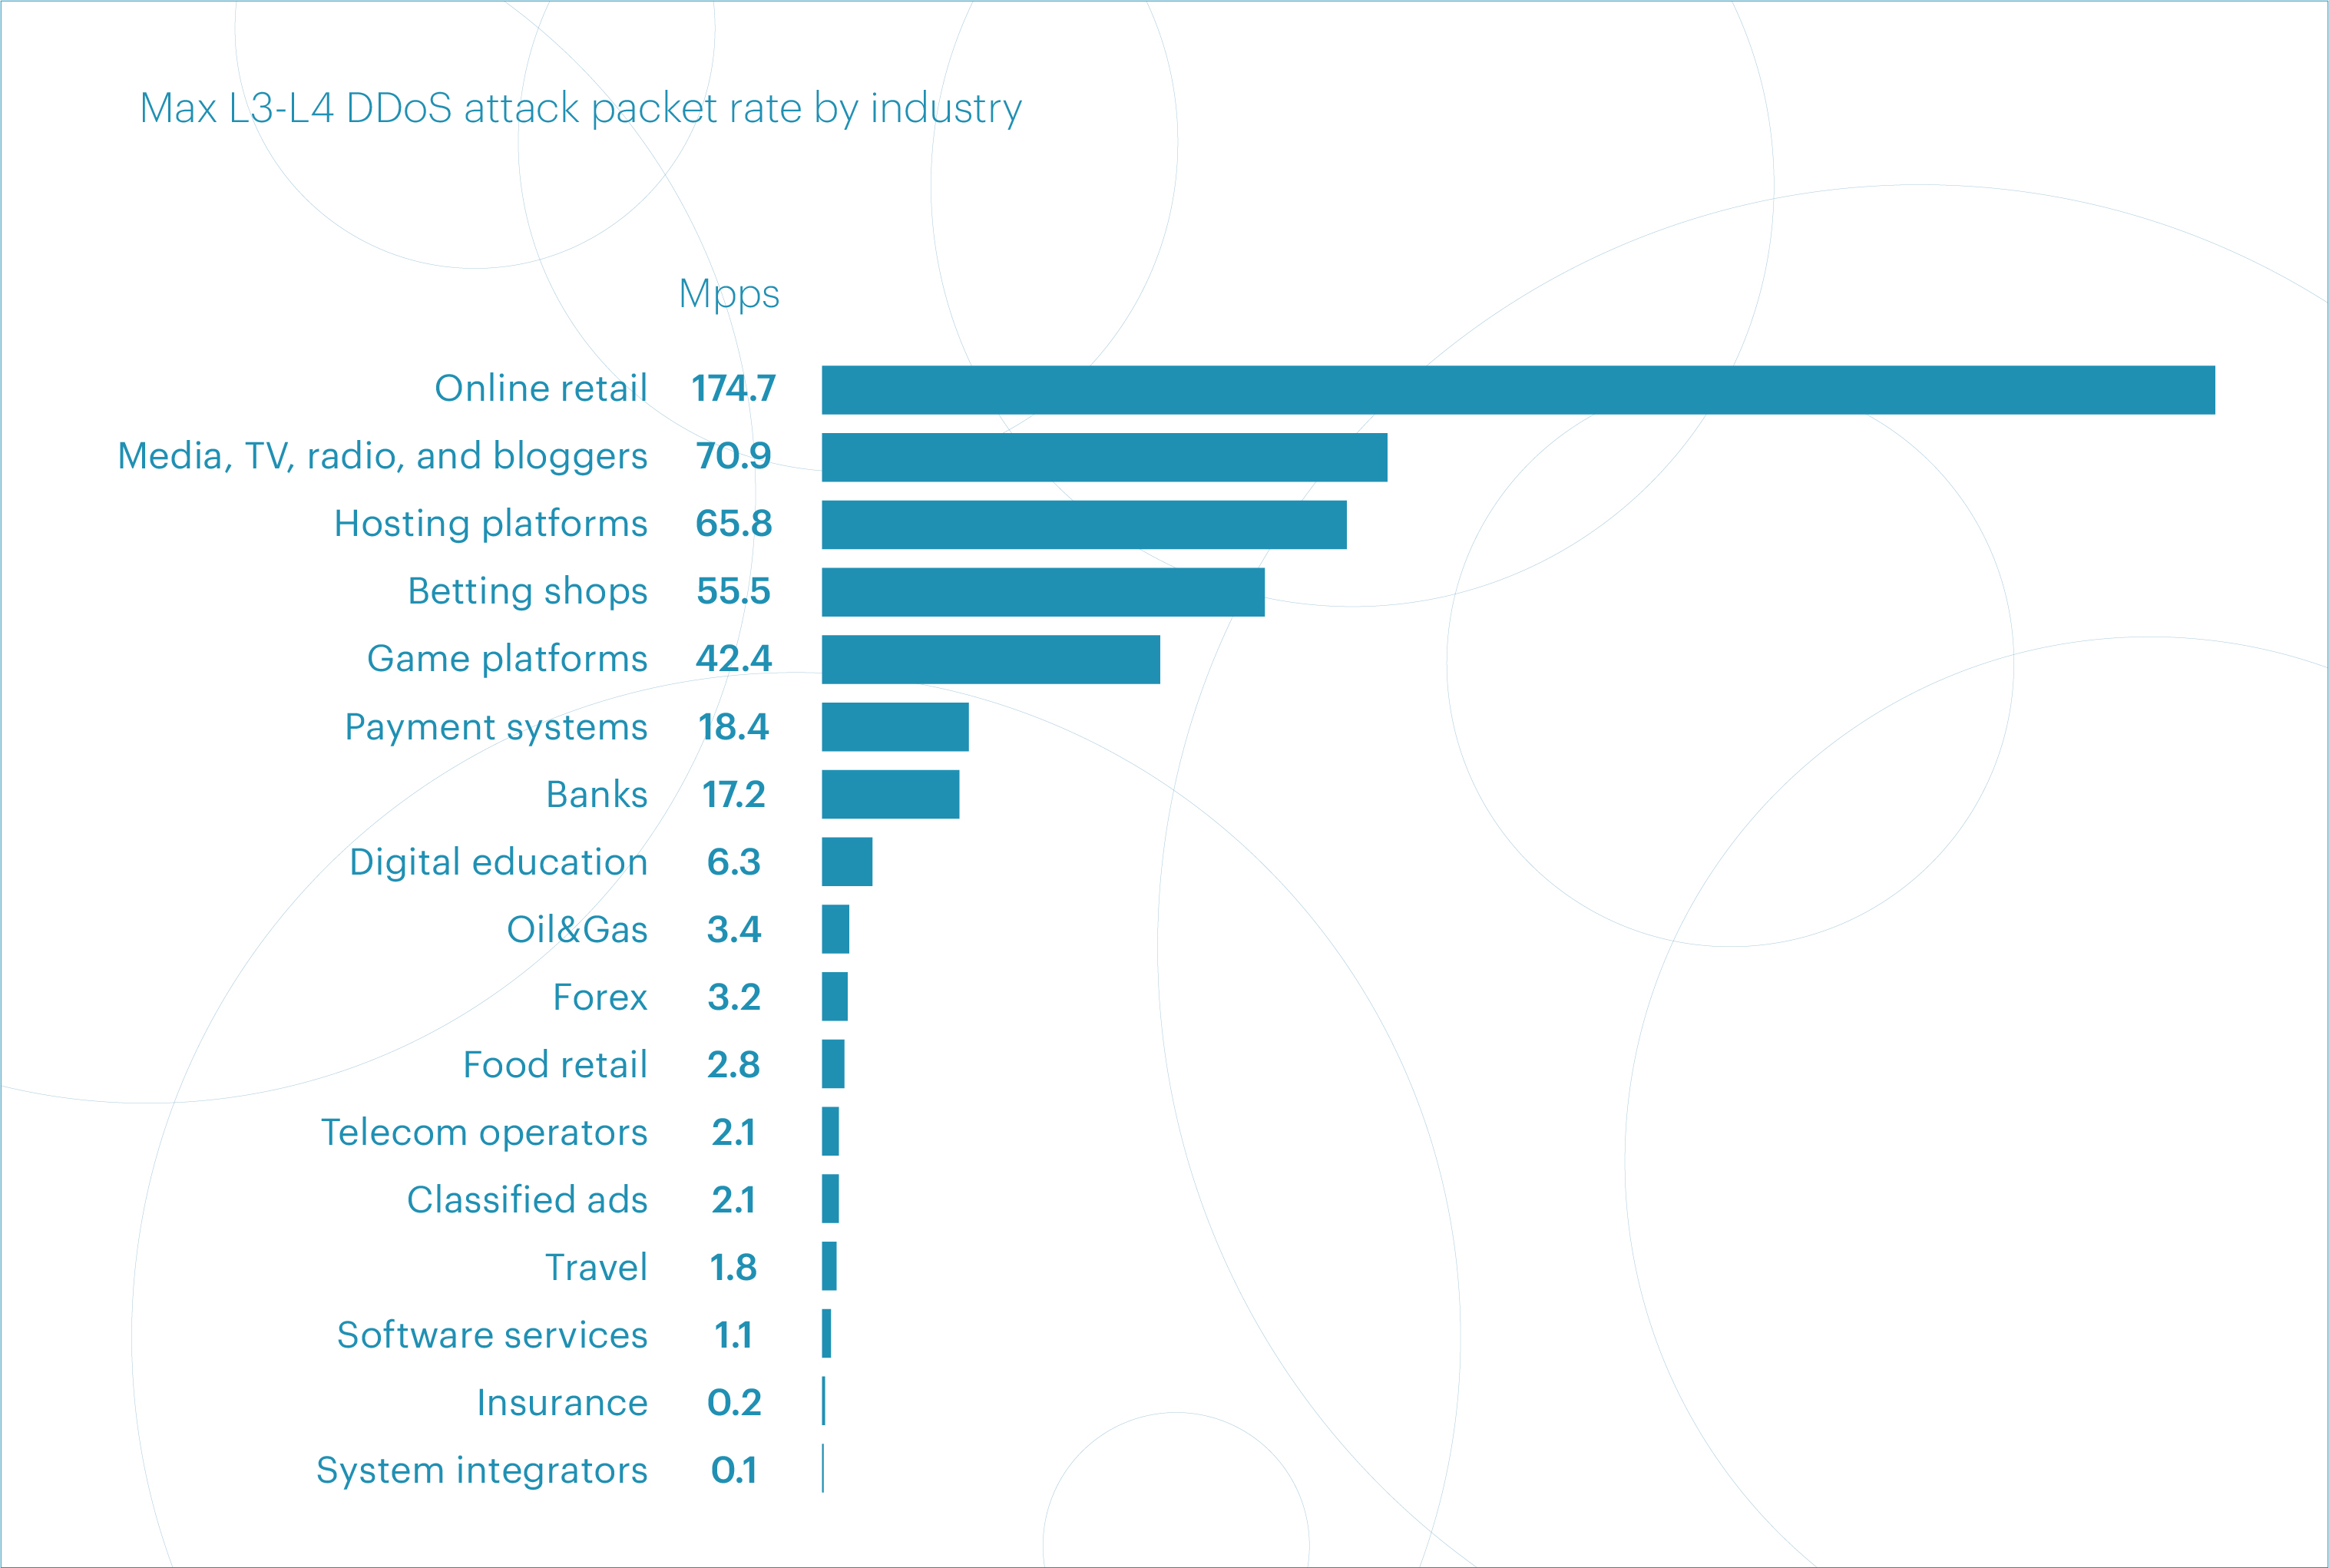
The same attack on Online retail also ranked highest by maximum packet rate, reaching 174.7 Mpps at its peak.
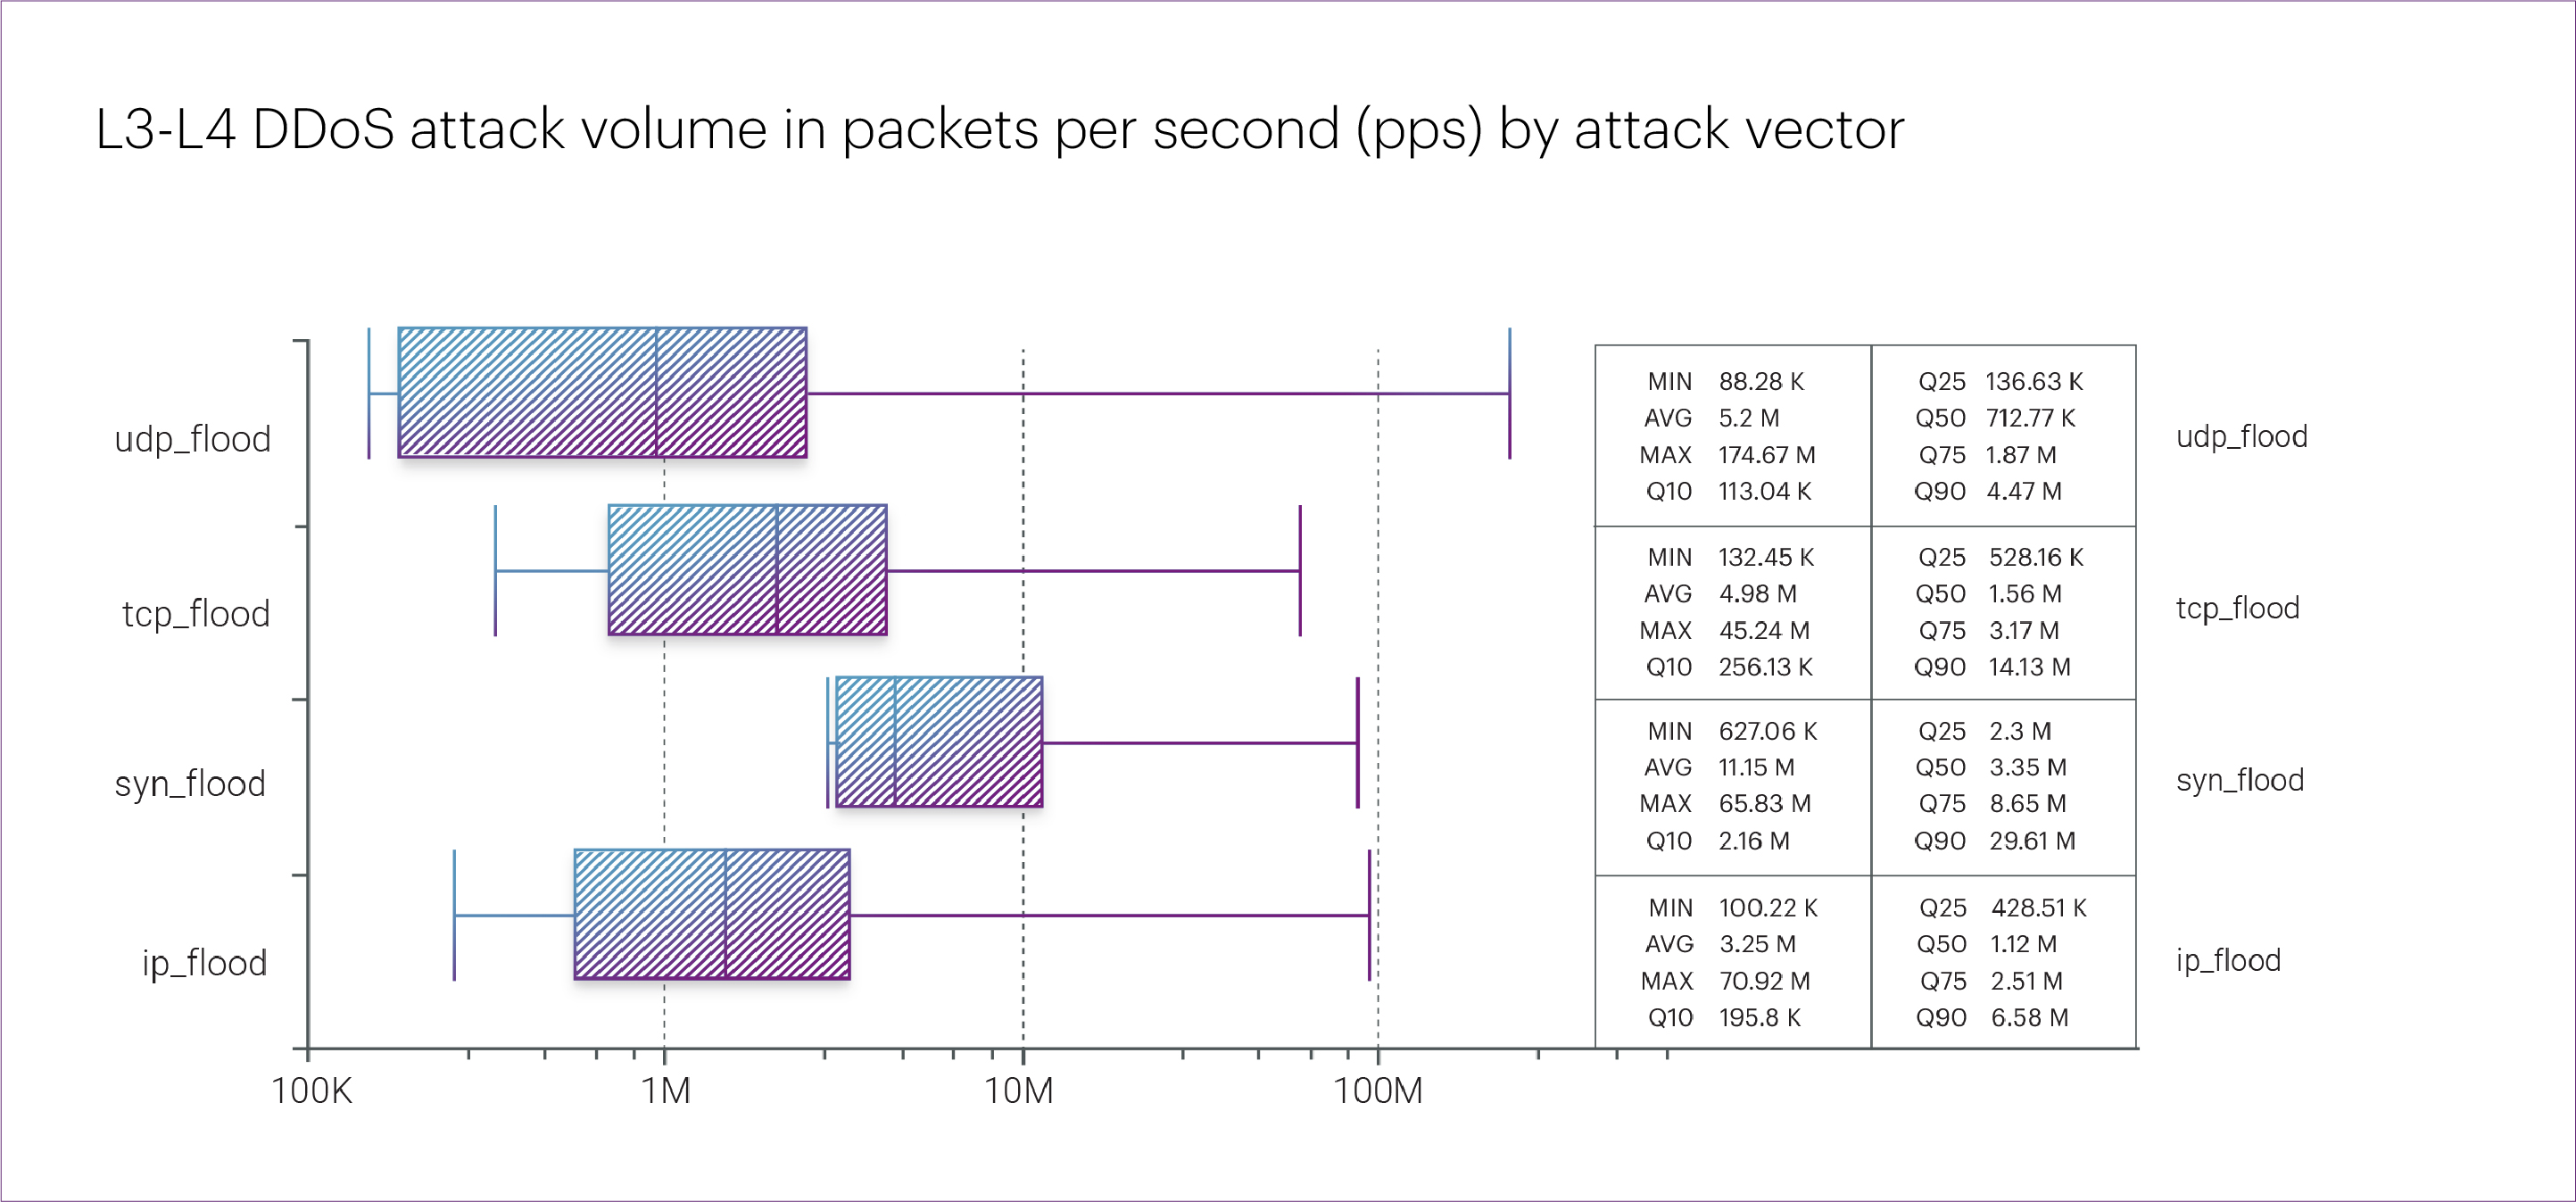
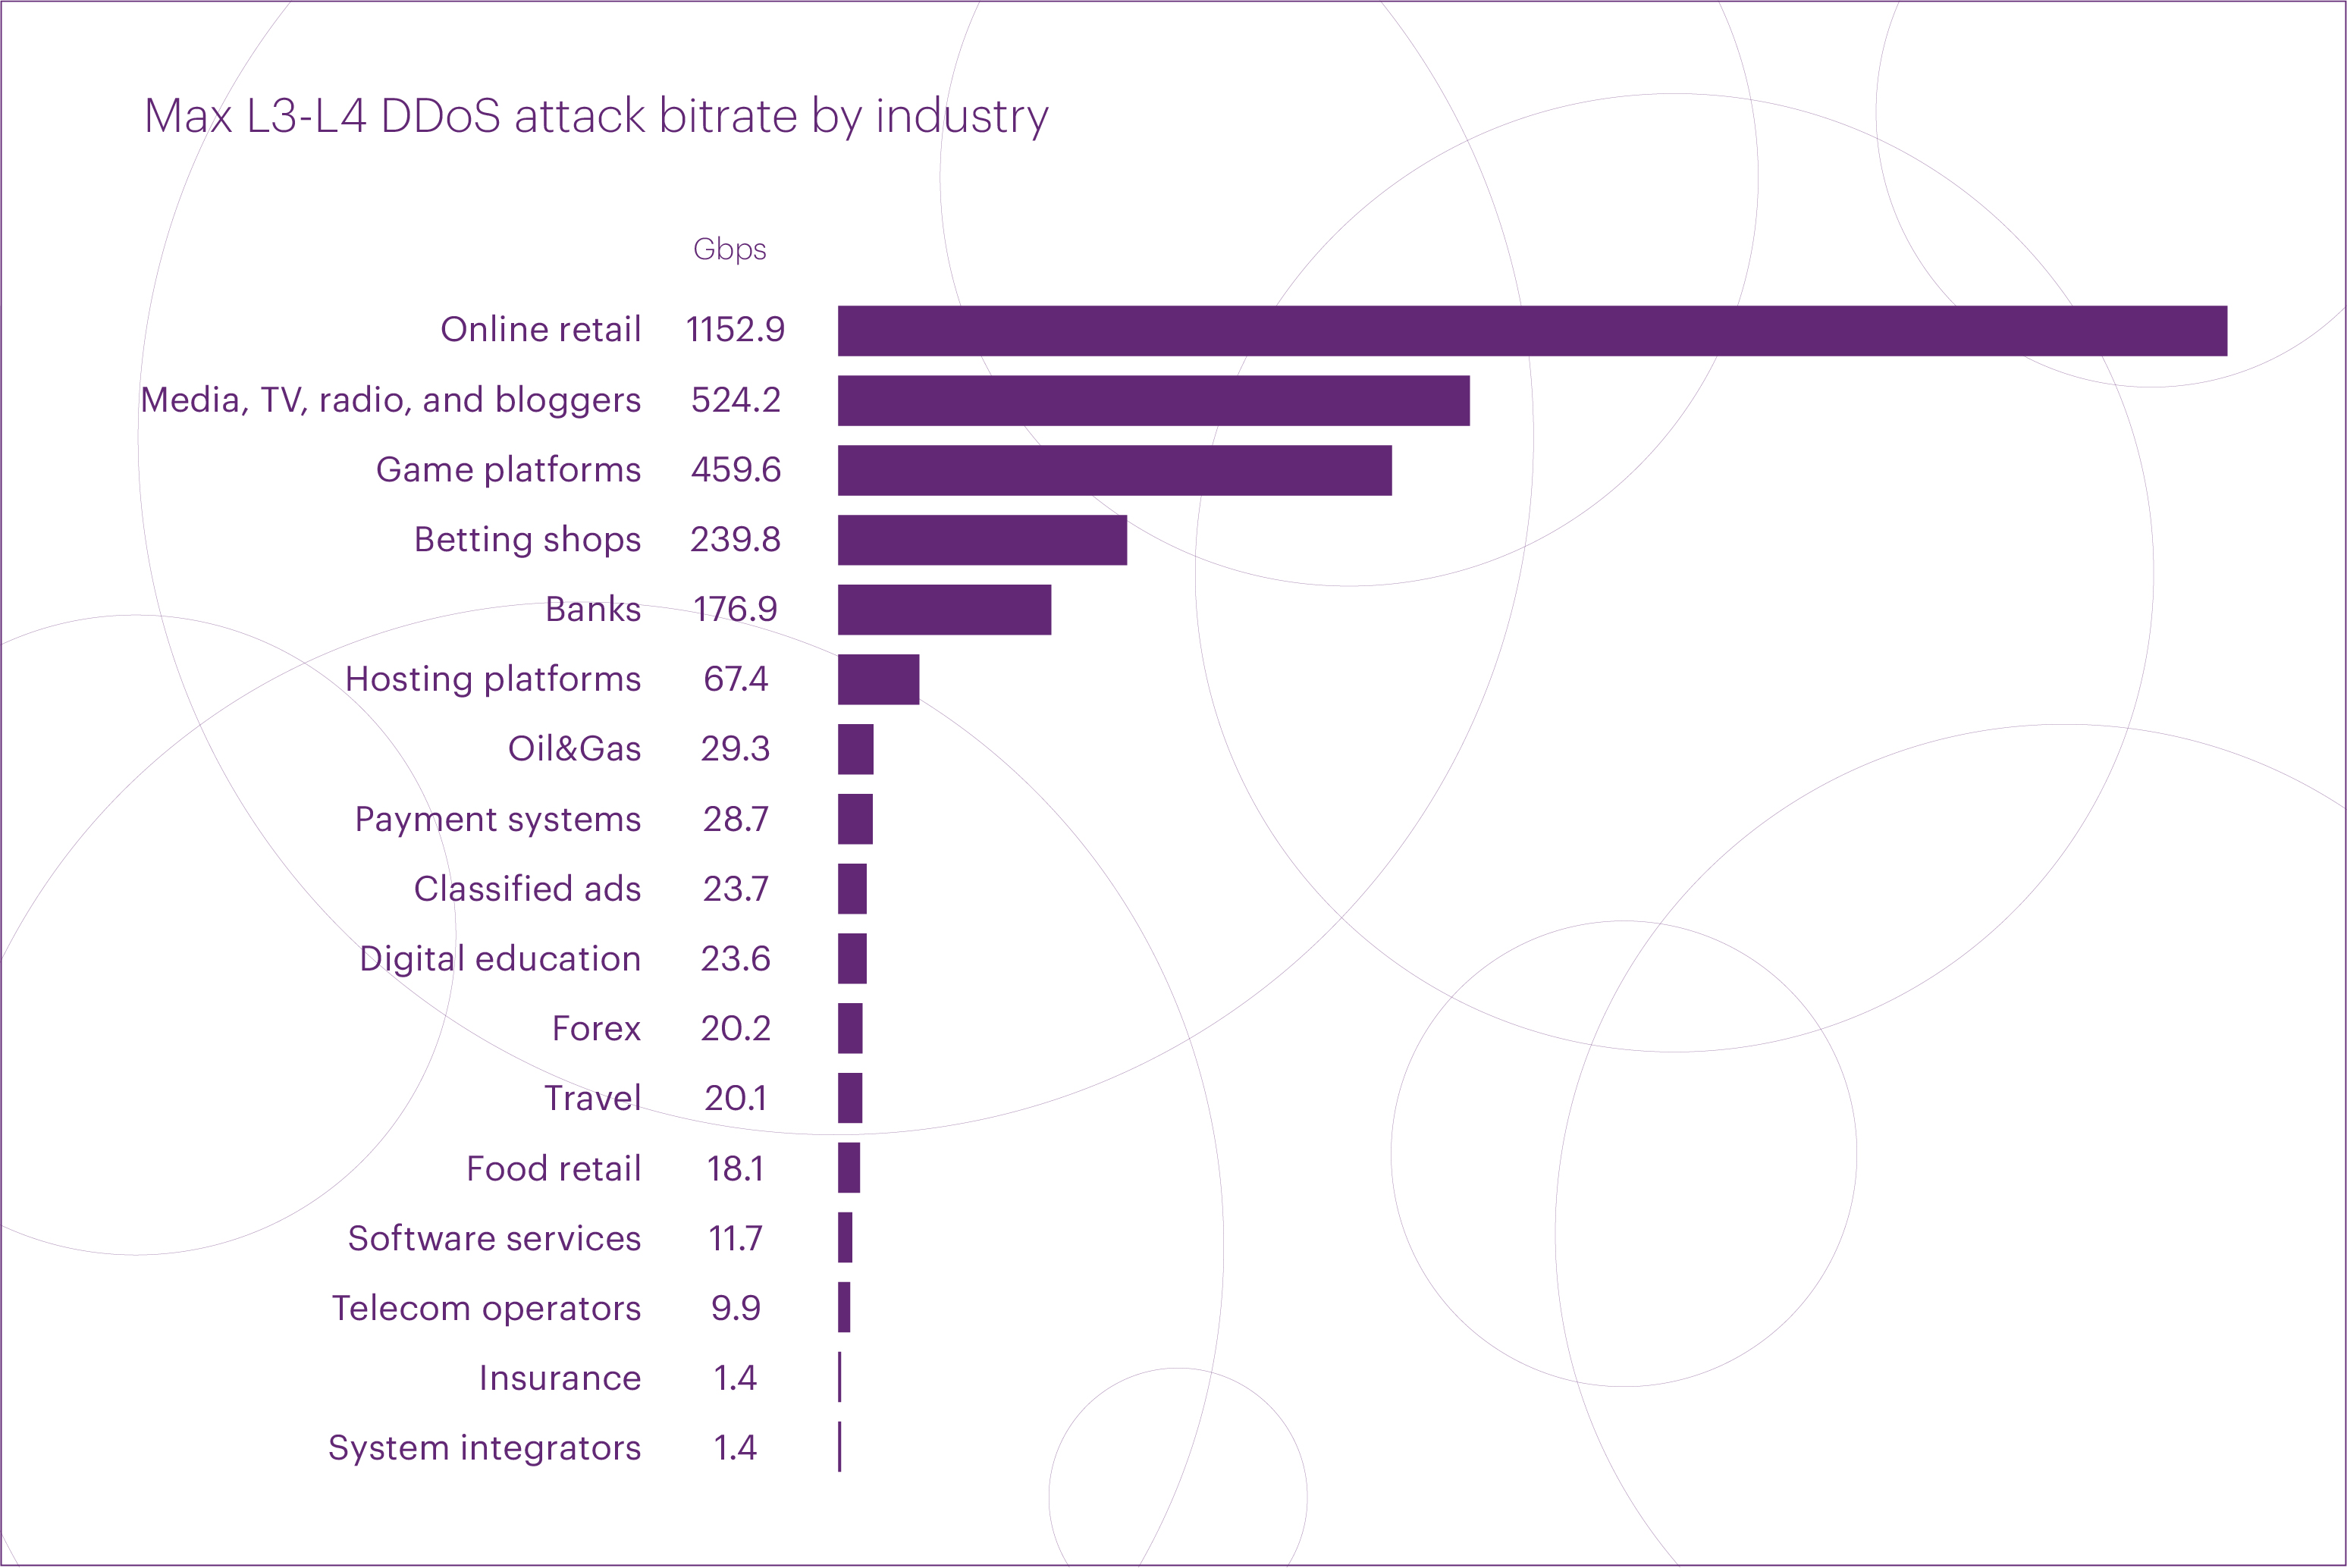
The top five microsegments that experienced the most intensive L3-L4 DDoS attacks in Q3 2025 were Online retail (1.15 Tbps), Media, TV, radio, and bloggers (524 Gbps), Gaming platforms (460 Gbps), Betting shops (240 Gbps), and Banks (177 Gbps).
The ranking by peak packet rate looked very similar: Online retail (174.7 Mpps), Media, TV, radio, and bloggers (70.9 Mpps), Hosting platforms (65.8 Mpps), Betting shops (55.5 Mpps), and Gaming platforms (42.4 Mpps).
The largest DDoS botnet
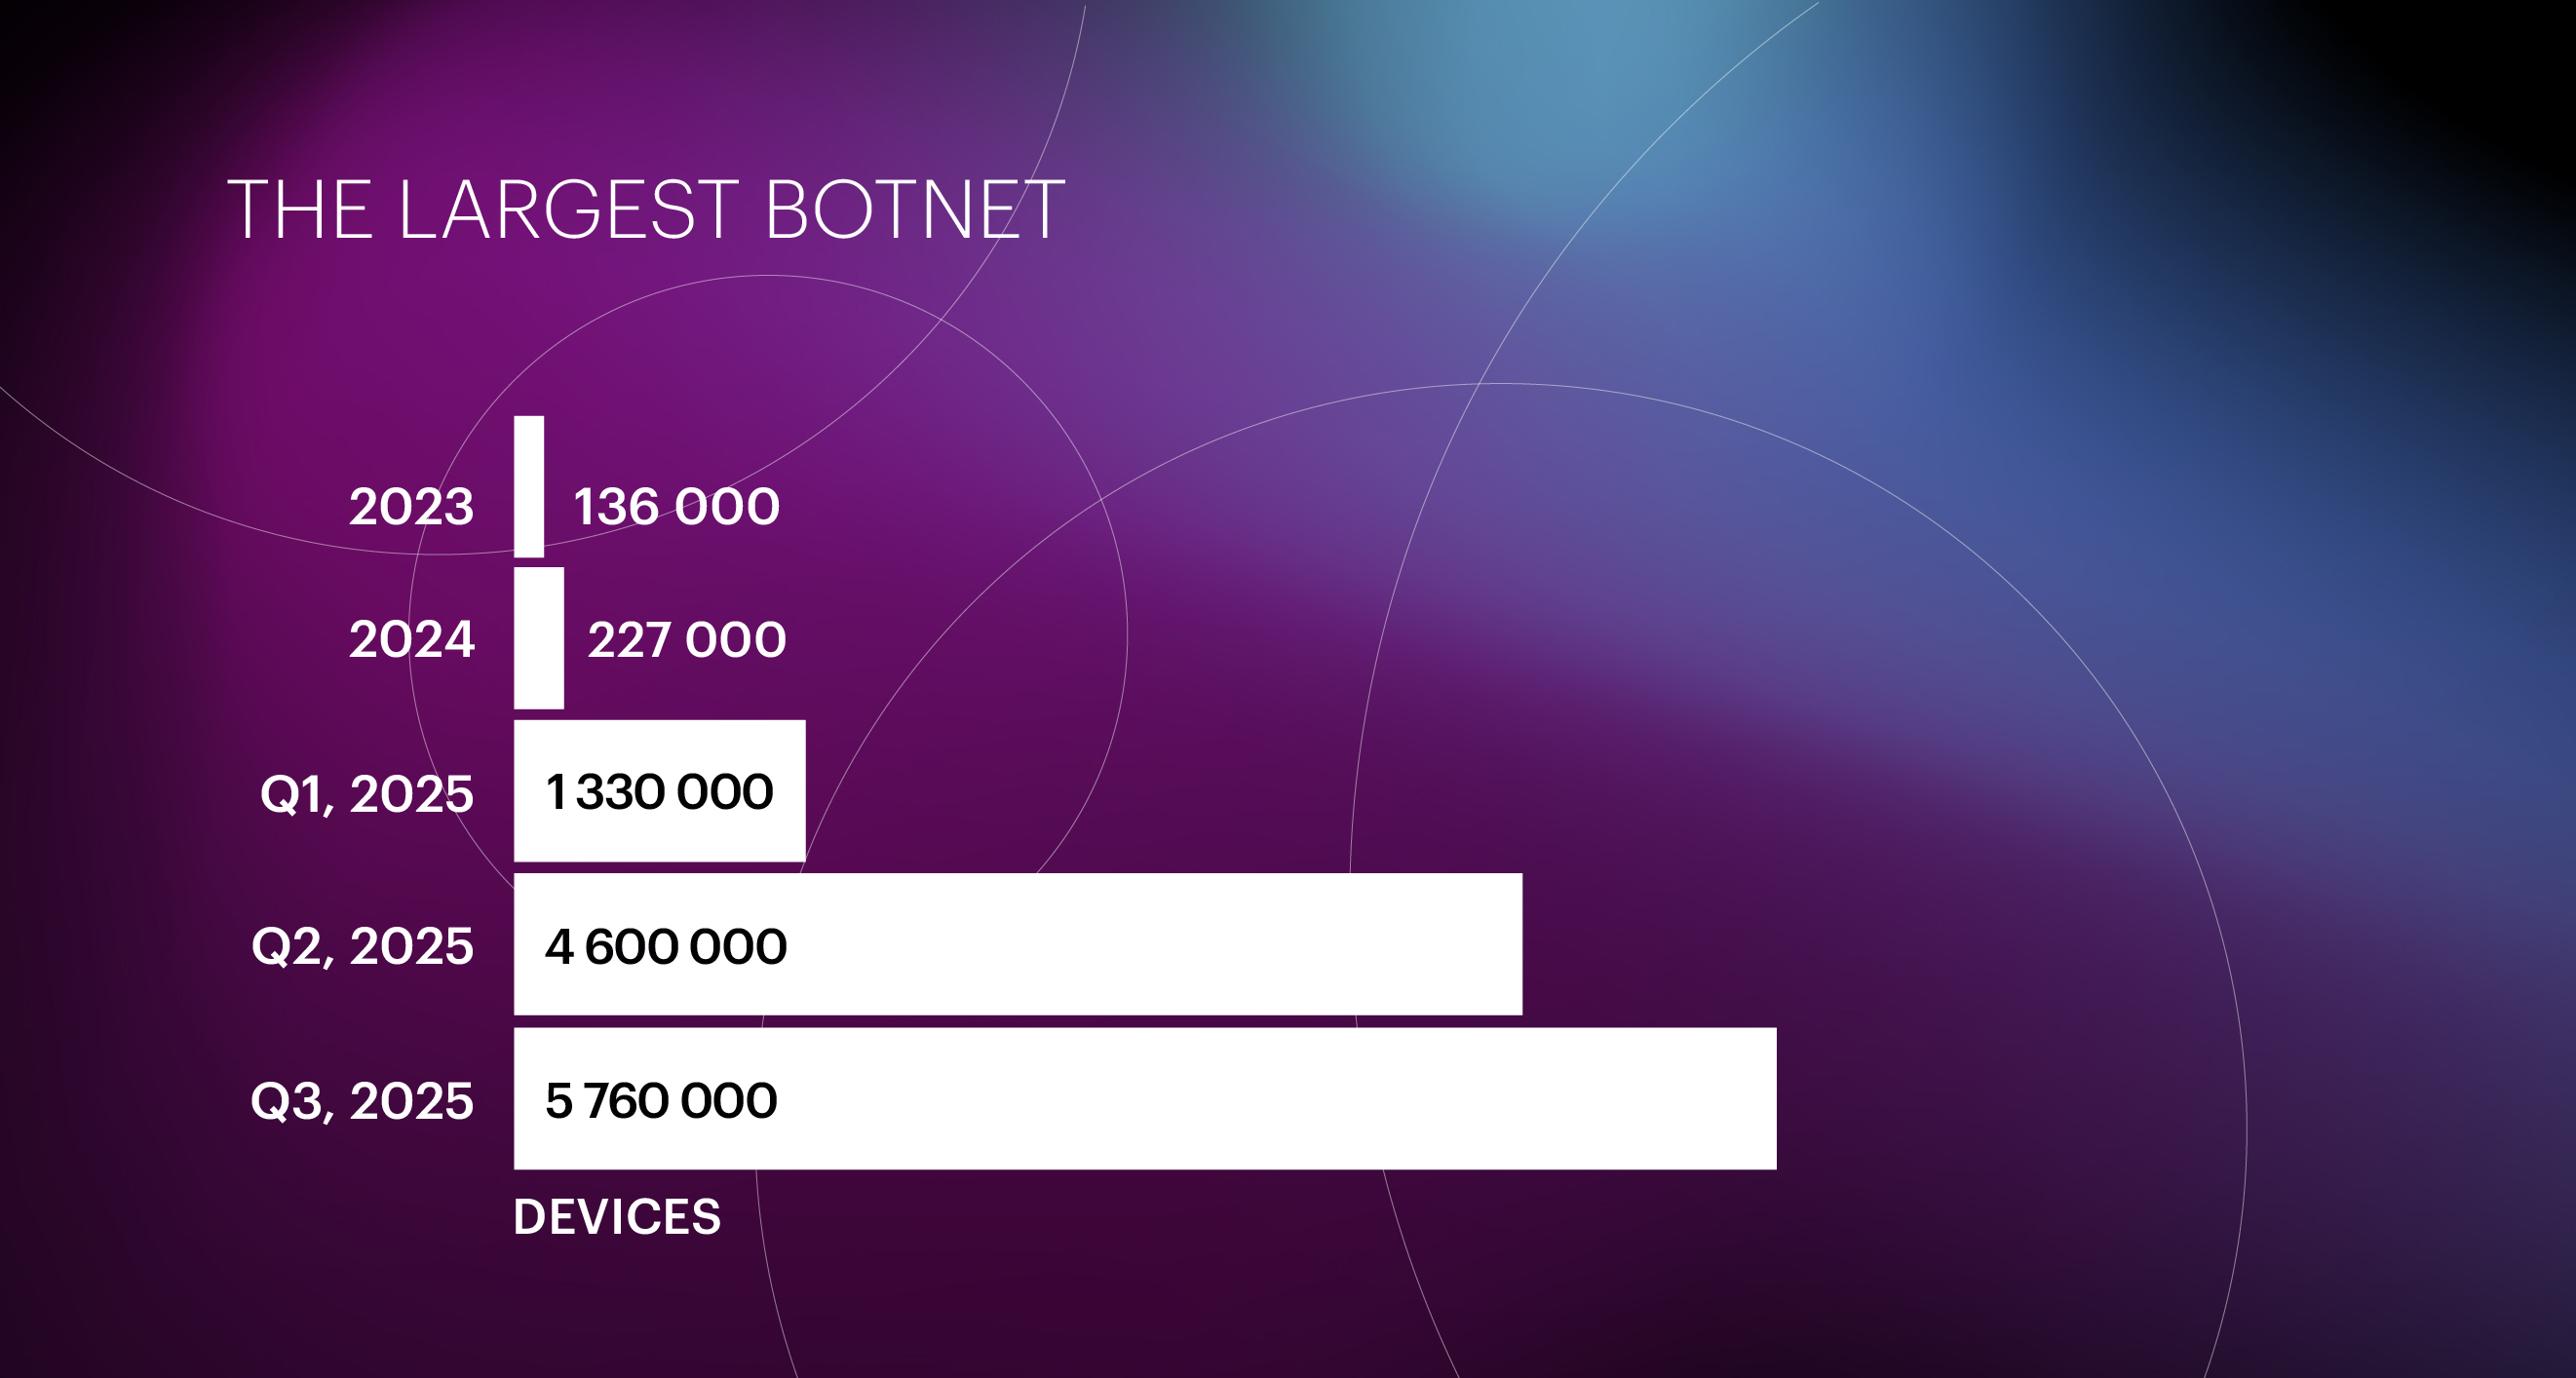
We continue to track a massive DDoS botnet that we first detected in Q1 2025. During its initial attack on March 26, 2025, we blocked 1.33 million IP addresses — primarily from Brazil (51.1%), followed by Argentina (6.1%), Russia (4.6%), Iraq (3.2%), and Mexico (2.4%).
In Q2, on May 16, 2025, we recorded another attack carried out by the same botnet, during which we blocked around 4.6 million IP addresses. By that time, the botnet’s geography had changed noticeably: Brazil’s share dropped from 51% to 29.7%; the share of devices from the United States (12.1%), Vietnam (7.9%), and India (2.9%) increased sharply; and Argentina (2.8%) ranked only fifth.
In Q3, on September 1, 2025, we observed another large-scale attack from the same DDoS botnet. During mitigation, we blocked 5.76 million IP addresses — meaning the botnet’s size more than quadrupled in less than six months.
The new attack targeted an organization in the Government resources segment. It lasted about two hours and unfolded in two waves: during the first stage, the attackers employed around 2.8 million IP addresses, and roughly an hour later, they added another 3 million.
The geographic distribution of IP addresses used by this DDoS botnet continues to shift. Although Brazil still ranks first, its share has dropped to 24.5% of all blocked IP addresses. The rest of the top five now includes Vietnam (11.5%), the United States (11.2%), India (7.1%), and Argentina (2.8%).
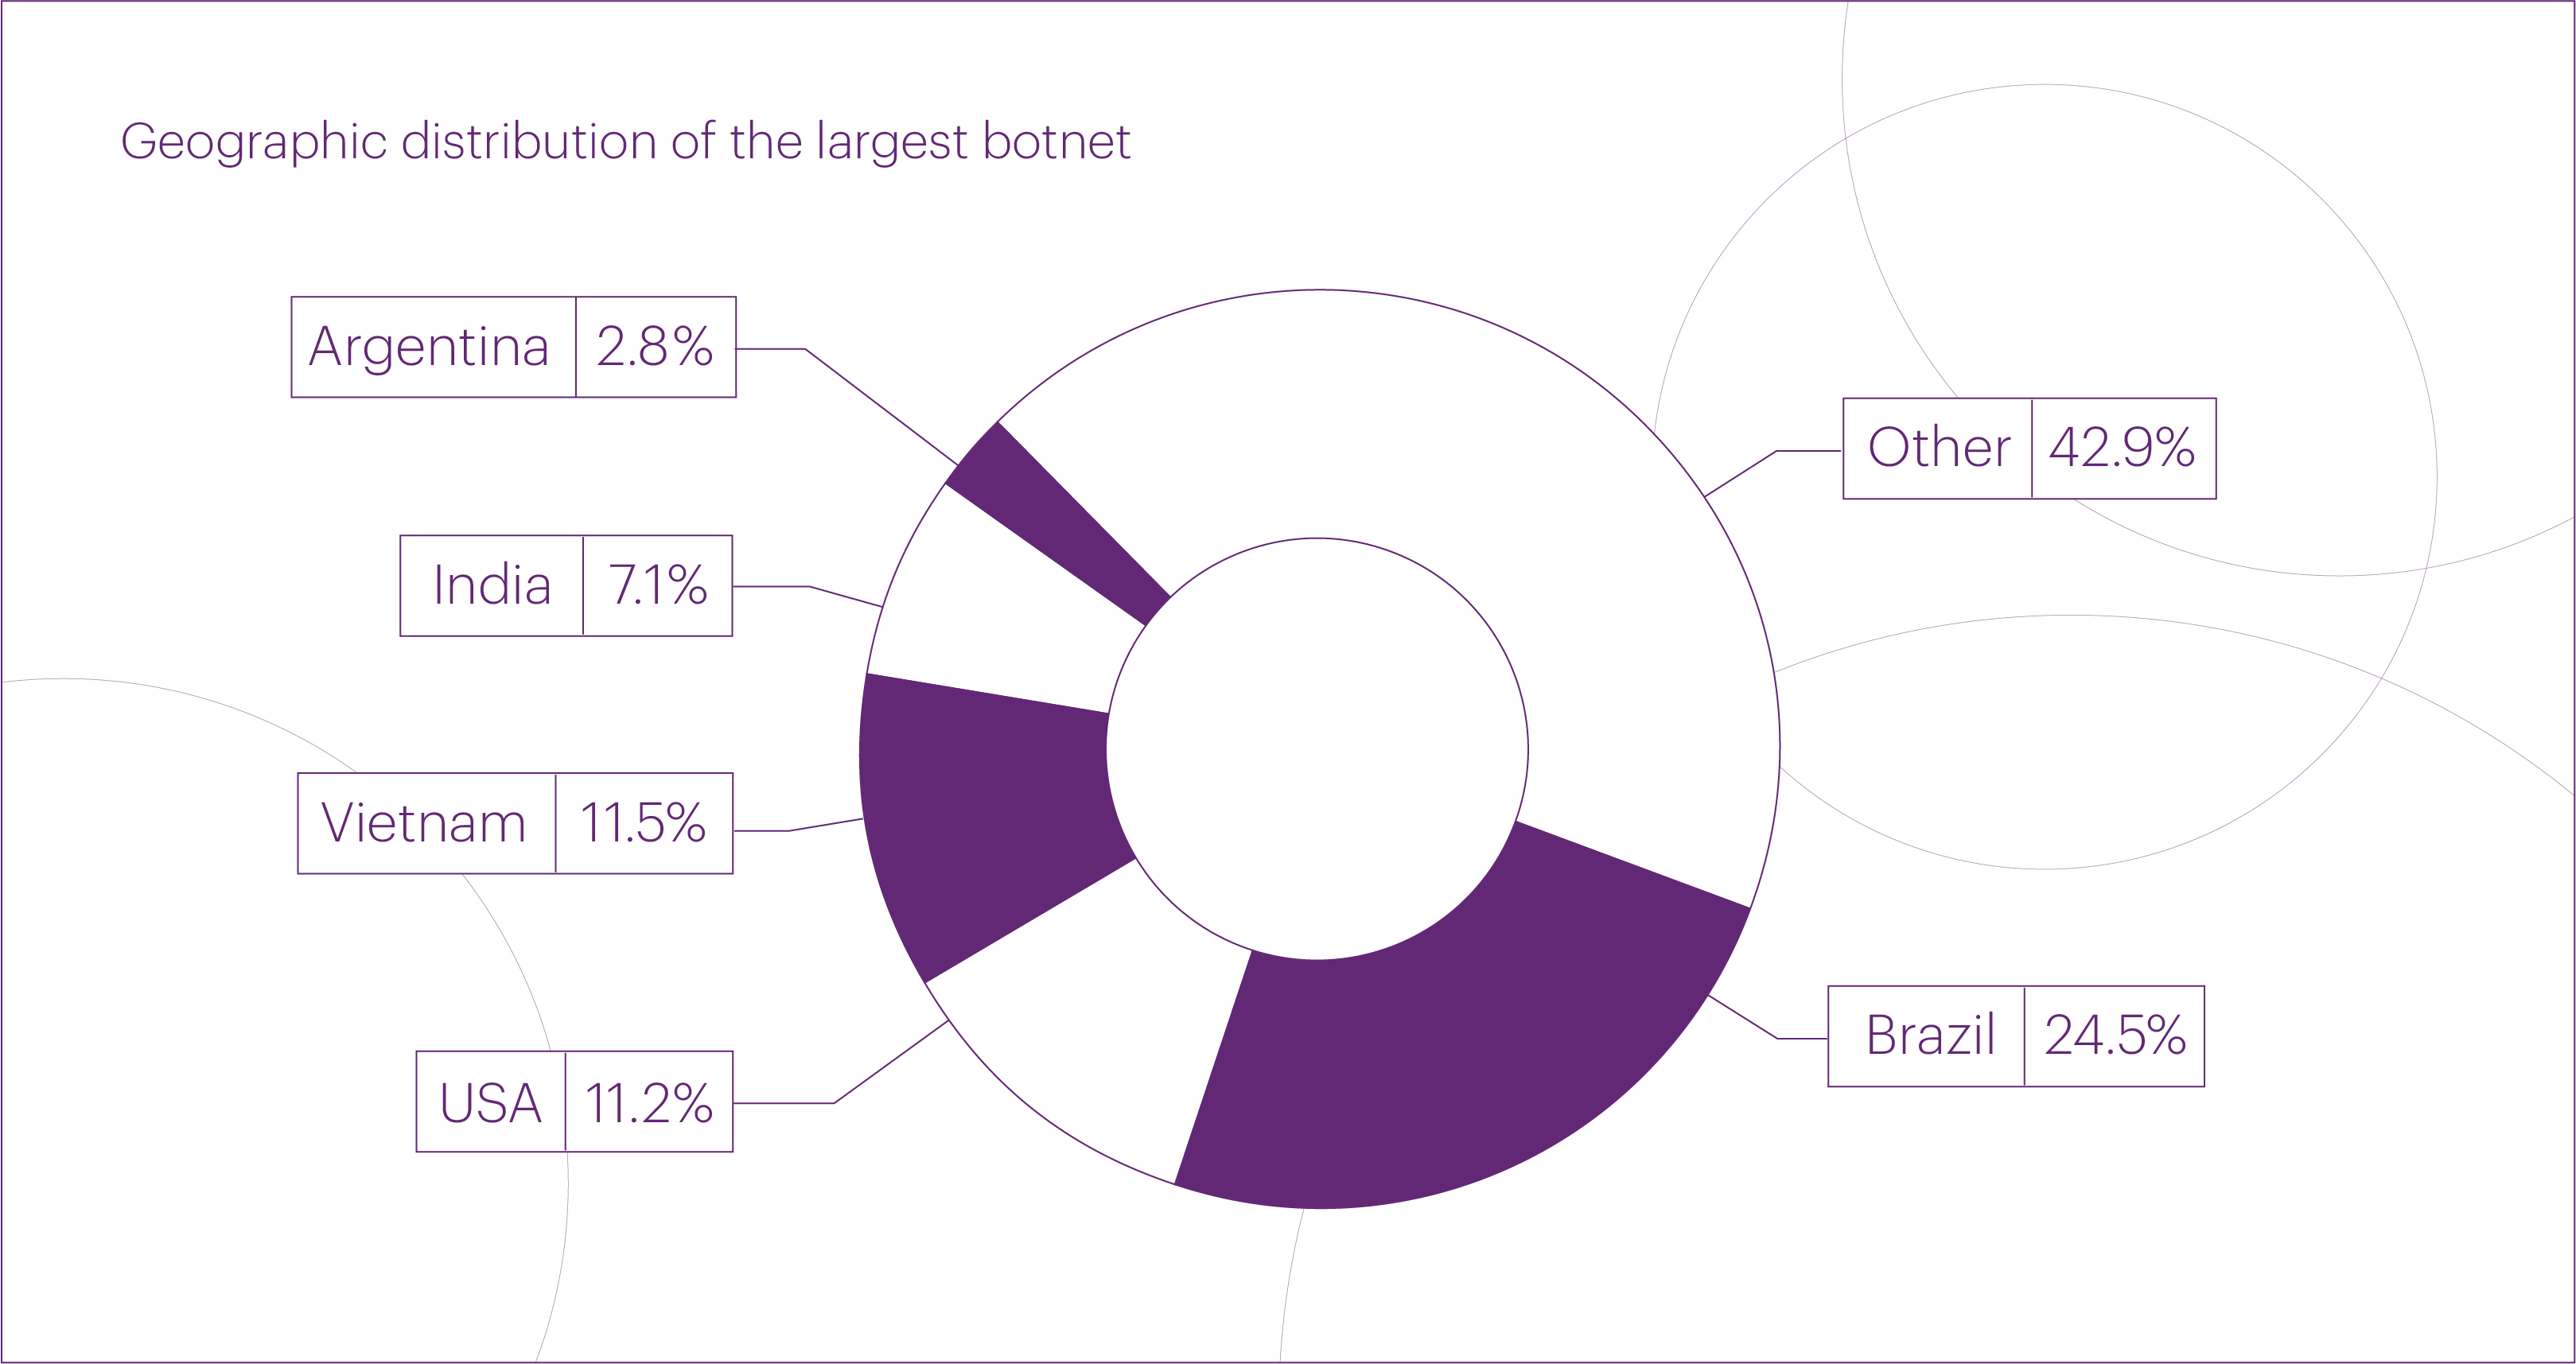
Vietnam (+83%) and India (+202%) showed the most impressive growth among the top five sources of malicious traffic compared to the previous attack by this botnet.
At the same time, the share of other countries increased from 32.6% in March to 42.9% in September, demonstrating the botnet operators’ active efforts to diversify its geographic footprint. This diversification makes simple geoblocking ineffective against attacks from this botnet, as its operators can switch to IP address ranges from virtually any country at any time.
Geographic distribution of L7 DDoS attack sources
In Q3 2025, for the first time in several years, there was a change in the ranking of countries most frequently serving as sources of application-layer DDoS attacks. Brazil took the lead with 19%, pushing Russia (18.4%) to second place and the United States (10.3%) to third. Notably, Brazil’s share has been steadily and rapidly increasing throughout the past year.
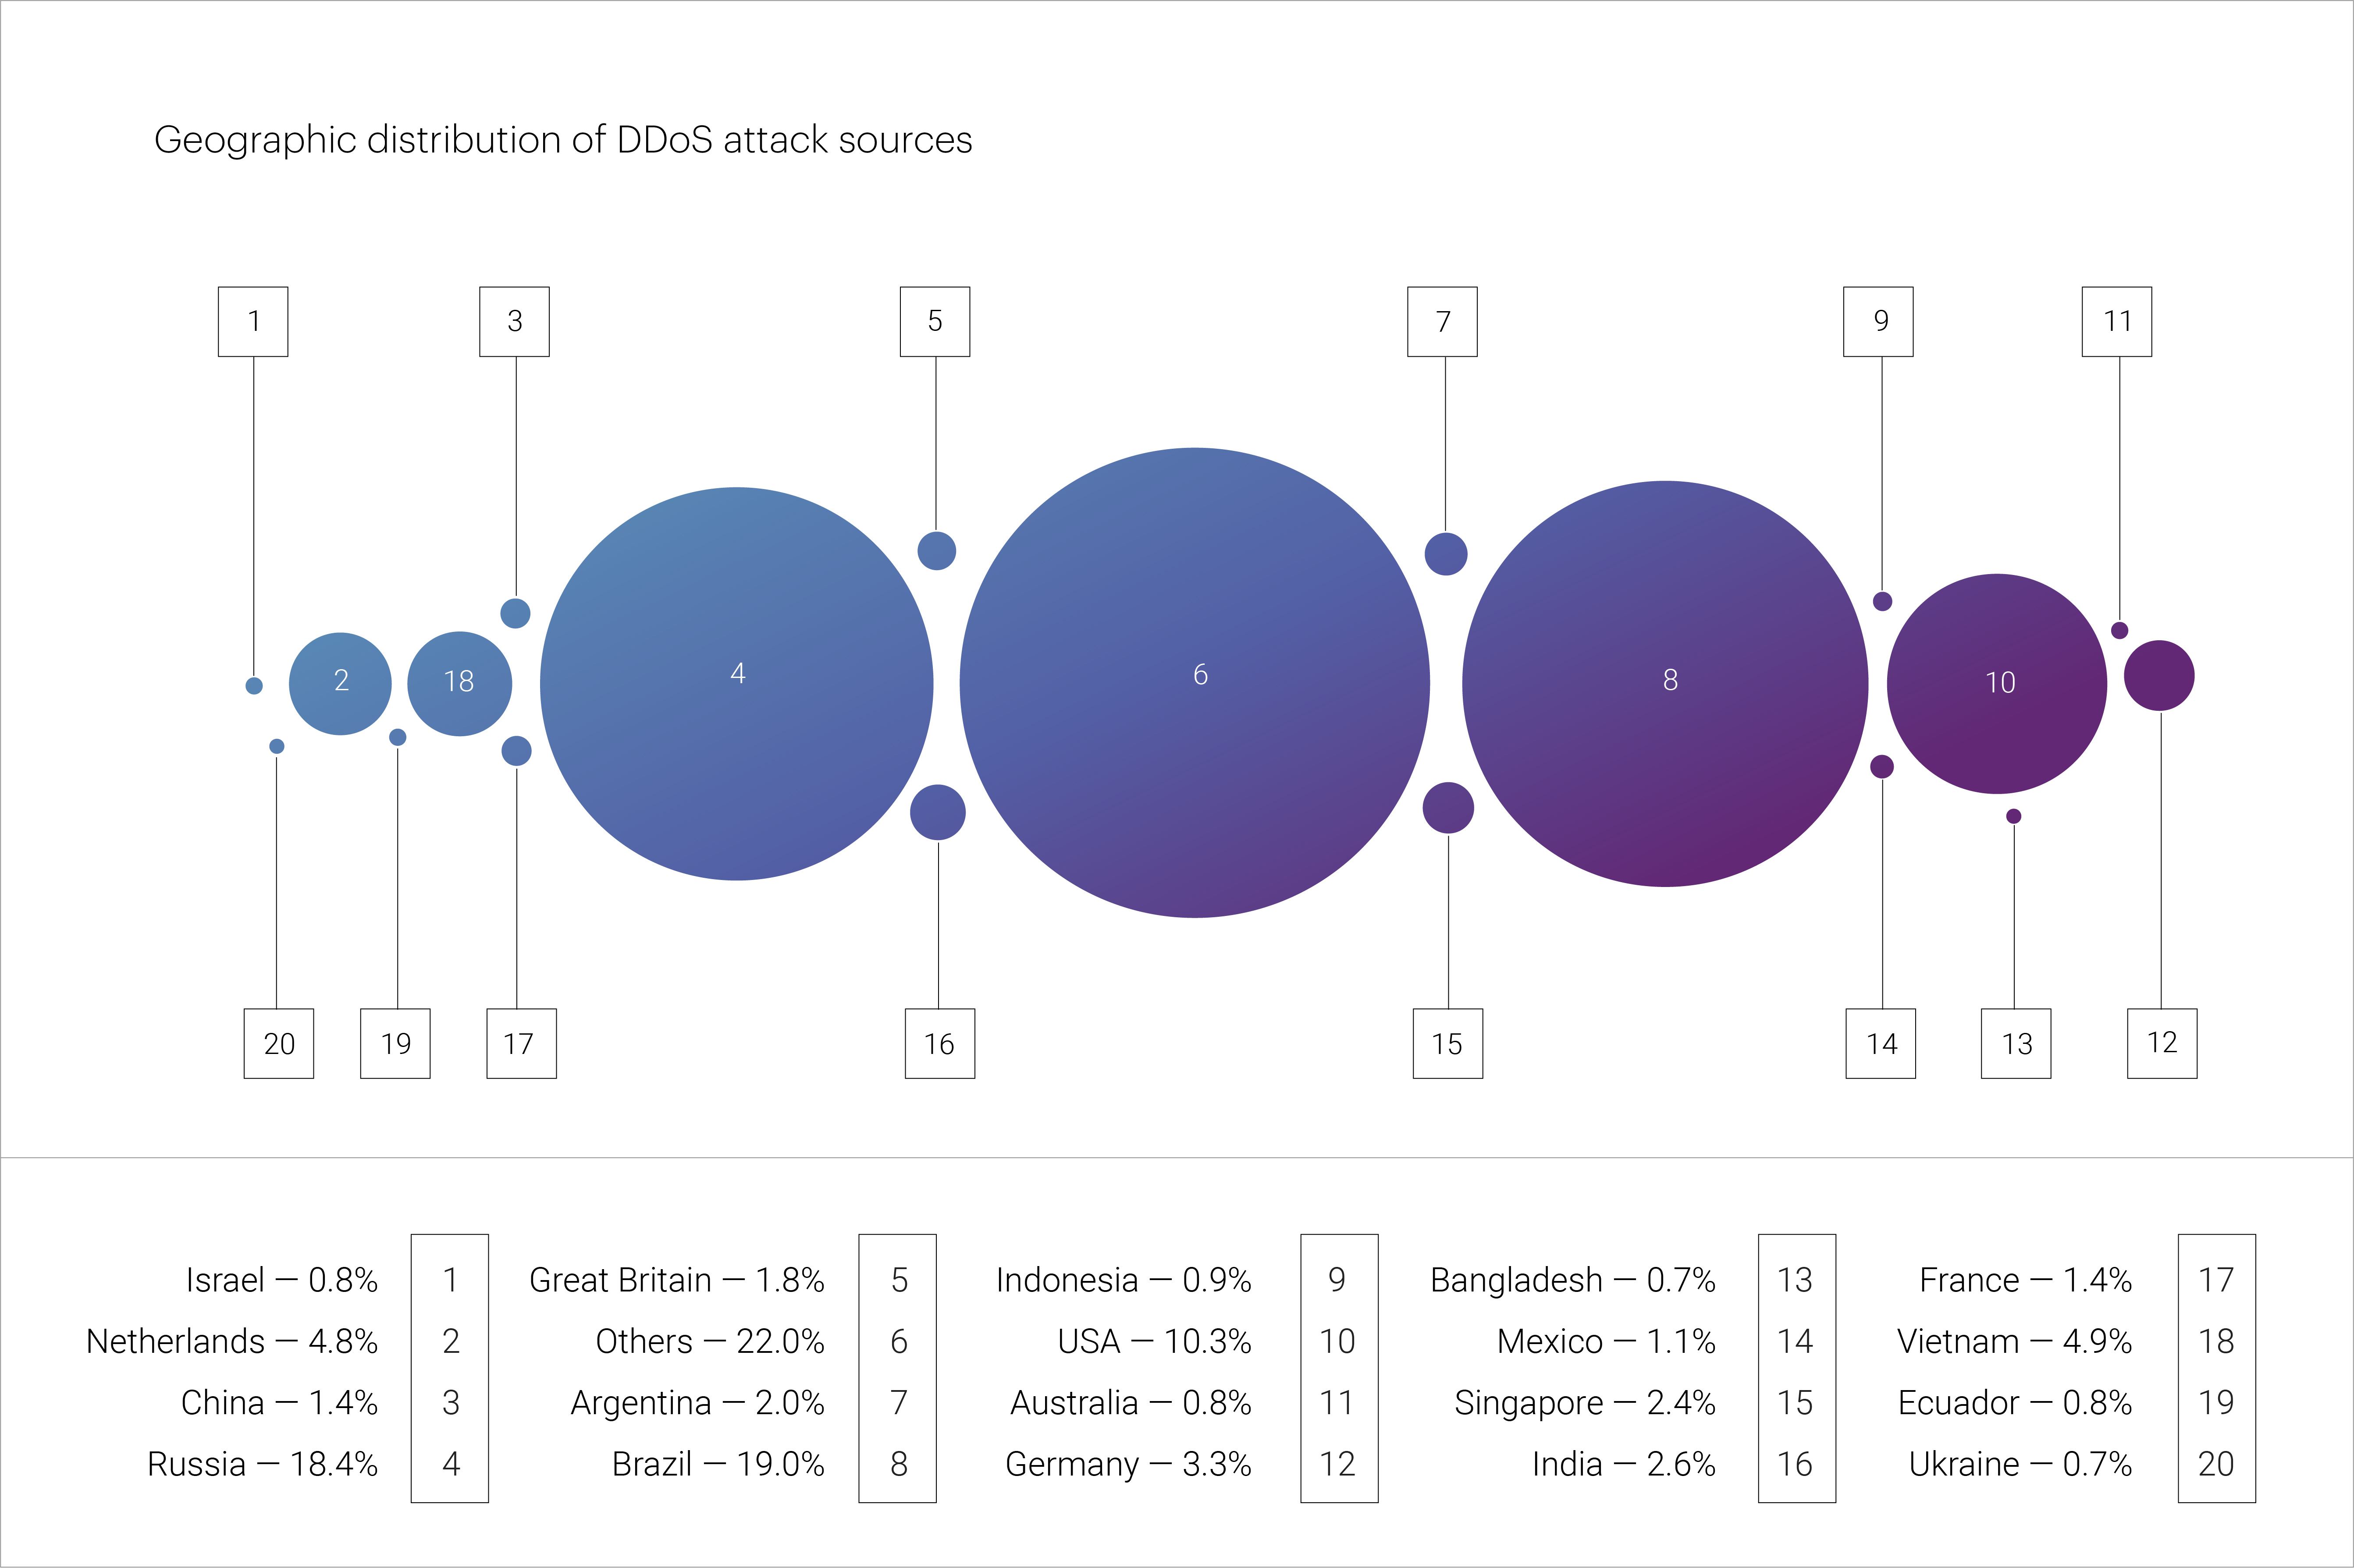
The top ten sources of L7 DDoS attacks also included Vietnam (4.9%), the Netherlands (4.8%), Germany (3.3%), India (2.6%), Singapore (2.4%), Argentina (2.0%), and the United Kingdom (1.8%). Together, these ten countries accounted for 69.5% of all IP addresses blocked during application-layer attack mitigation in Q3.
Note that Vietnam’s share has shown steady growth — rising from 15th place in the ranking a year ago to fourth place in Q3 2025.
We attribute the emergence of massive DDoS botnets and the growing share of developing countries among application-layer attack sources to two main trends.
On the one hand, there is outpacing digitalization in developing countries — a rapid increase in the number of devices connected to high-speed Internet, combined with low cybersecurity awareness and a high number of vulnerabilities.
On the other hand, there is the widespread availability of AI-powered tools actively used by attackers. Artificial intelligence enables them to automate the search for and exploitation of vulnerable devices, greatly accelerating the creation and expansion of botnets.
Bad bot protection statistics — Qrator.AntiBot
To avoid confusion, it’s important to clarify that “bad bots” refer to automated systems that attempt to interact with websites while pretending to be legitimate users. Unlike destructive DDoS bots, bad bots do not aim to disrupt a site’s operation. Their goals typically include data scraping, artificially inflating metrics, brute-forcing accounts, and other unwanted activities.
After a 31% surge in bad bot traffic in Q2 2025, Q3 saw an equally sharp decline of 37%, despite a noticeable increase in the number of resources protected by Qrator.AntiBot.
As we noted in the previous report, the growth observed in Q2 was almost entirely driven by a single, exceptionally large-scale attack that lasted more than a month. Once it ended in May, bad bot traffic volumes targeting protected resources dropped significantly.
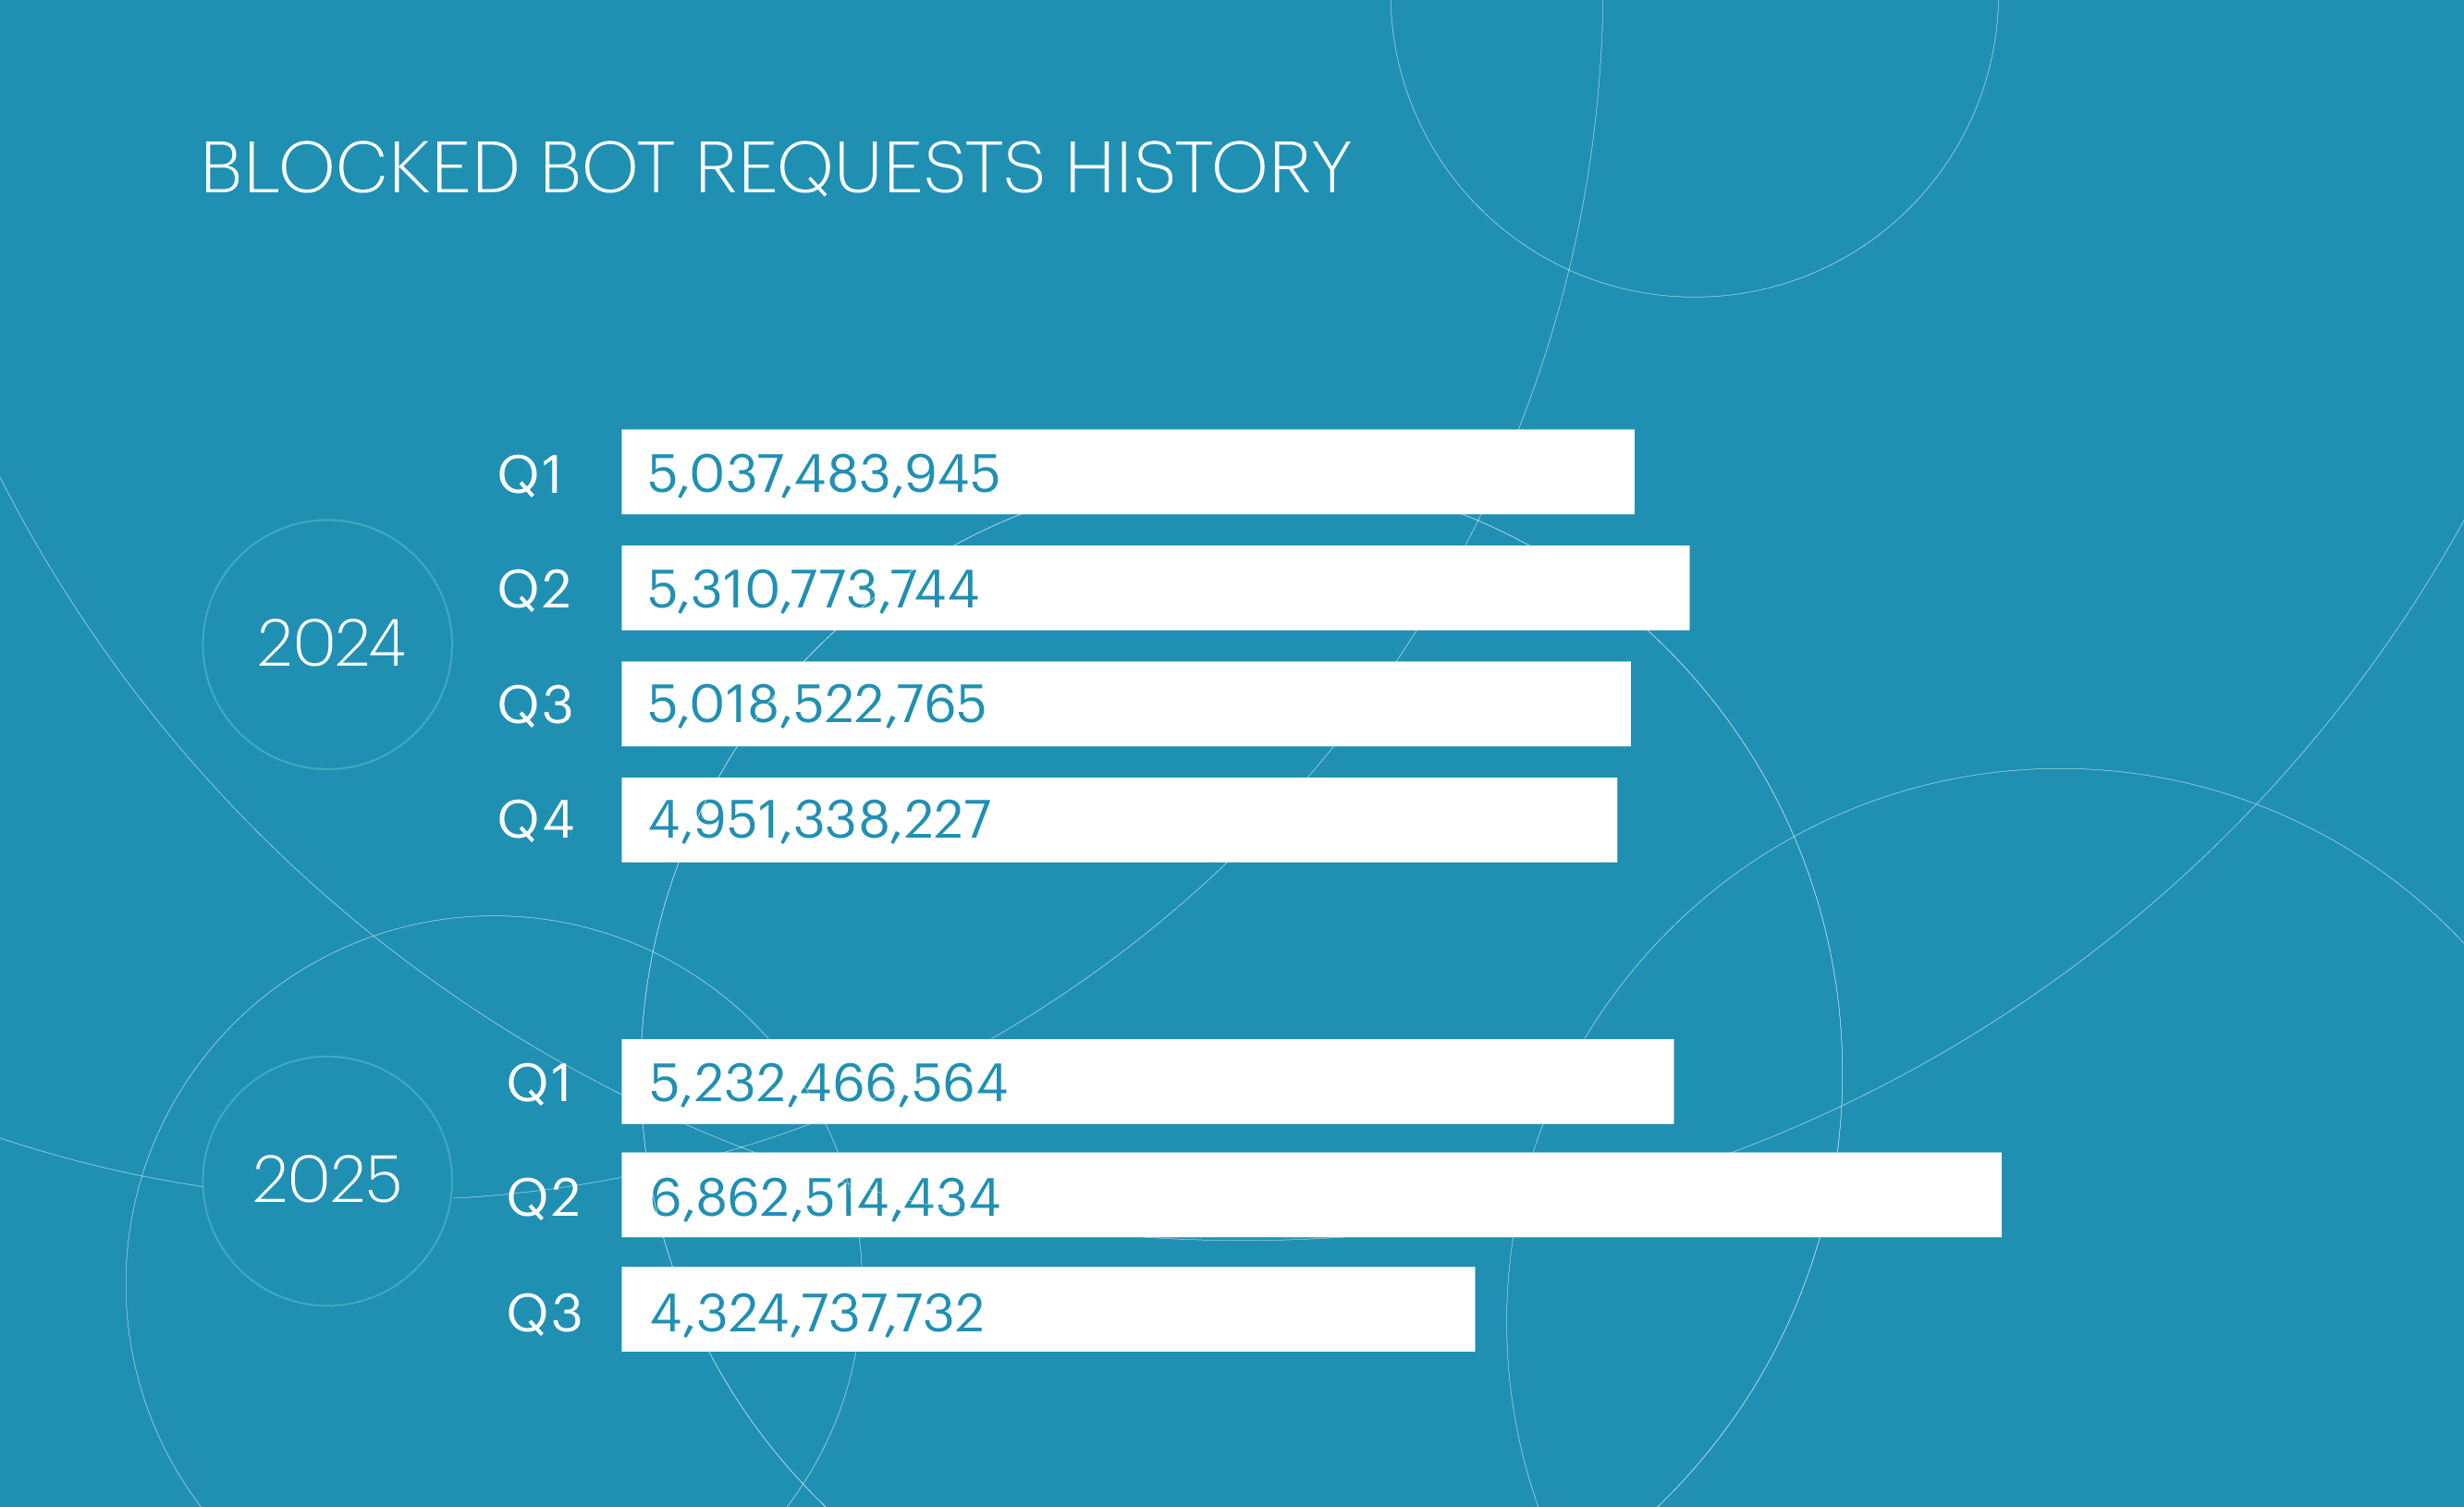
The quiet period largely covered the summer months, after which bad bot activity began to pick up again in September.
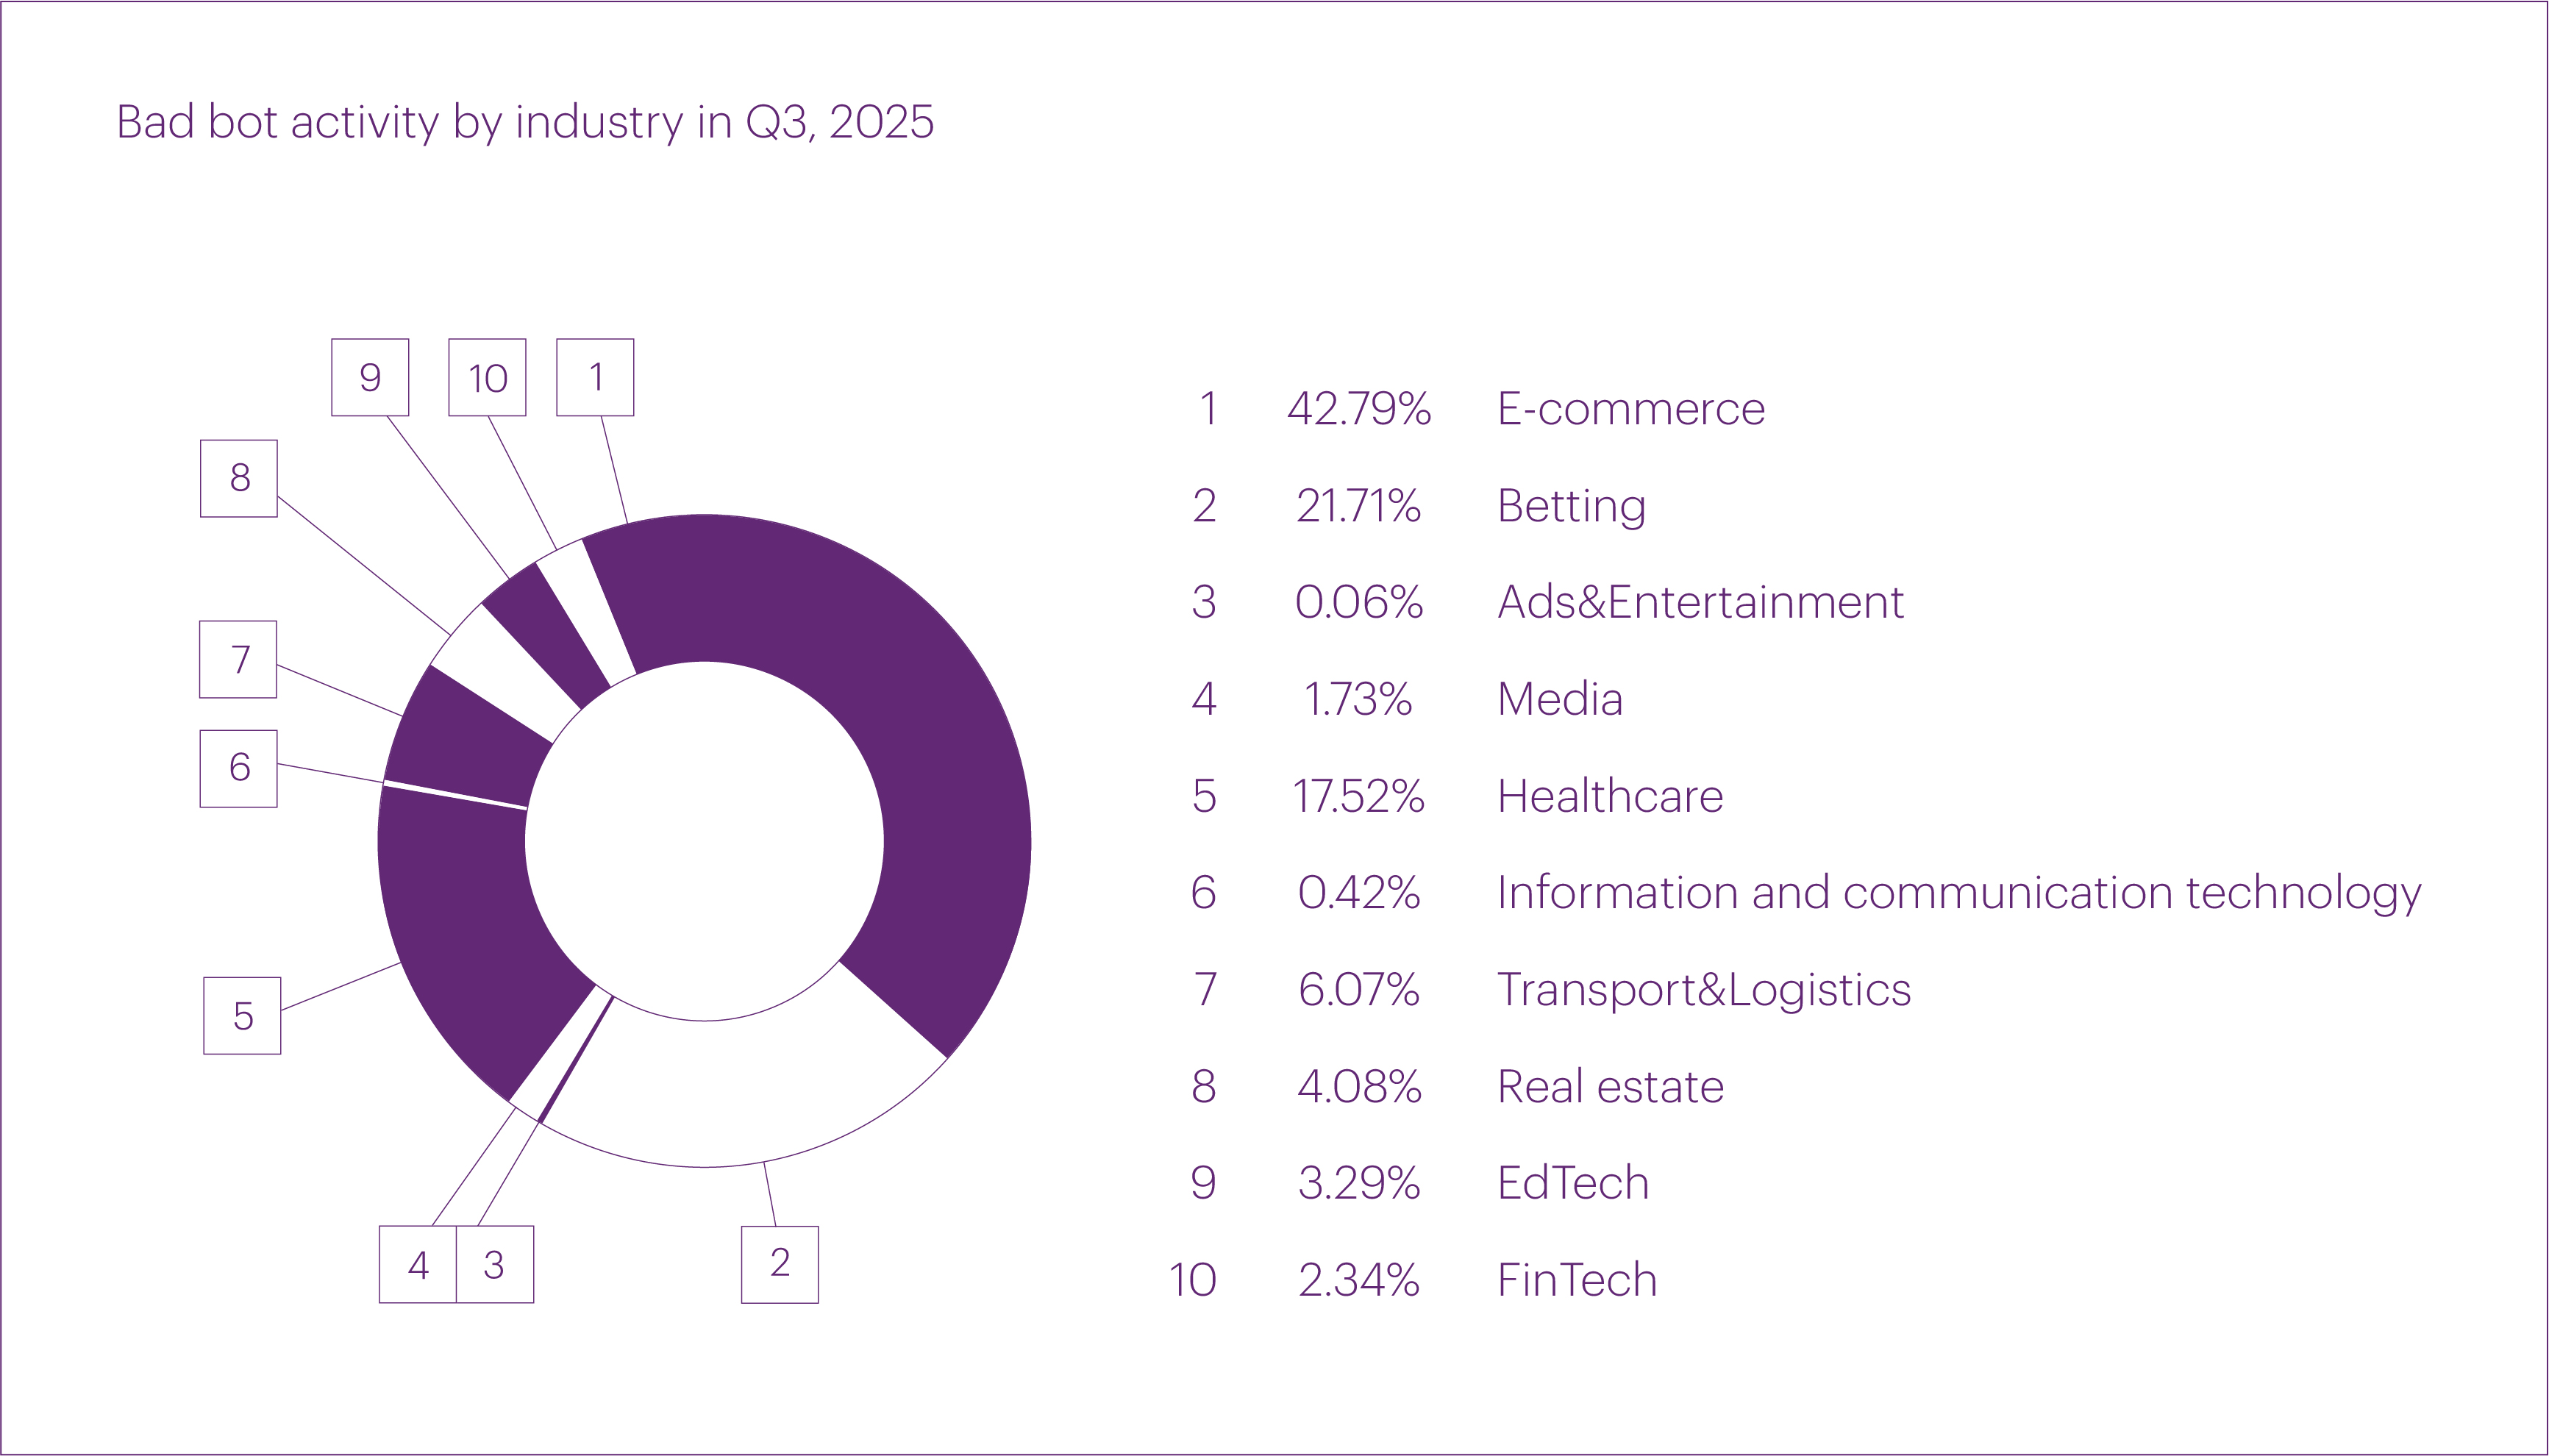
In Q3 2025, bad bot attacks primarily targeted the E-commerce (42.79%) and Betting (21.71%) segments, which have traditionally led this ranking. The Healthcare segment unexpectedly ranked third this quarter (17.52%), mainly due to a significant volume of traffic directed at a single resource.
Since last quarter, we have been analyzing what we call the bot index: the share of bot traffic within the total traffic to protected resources. In Q3 2025, this indicator dropped significantly compared to Q2, from 2.34% to 1.36%.
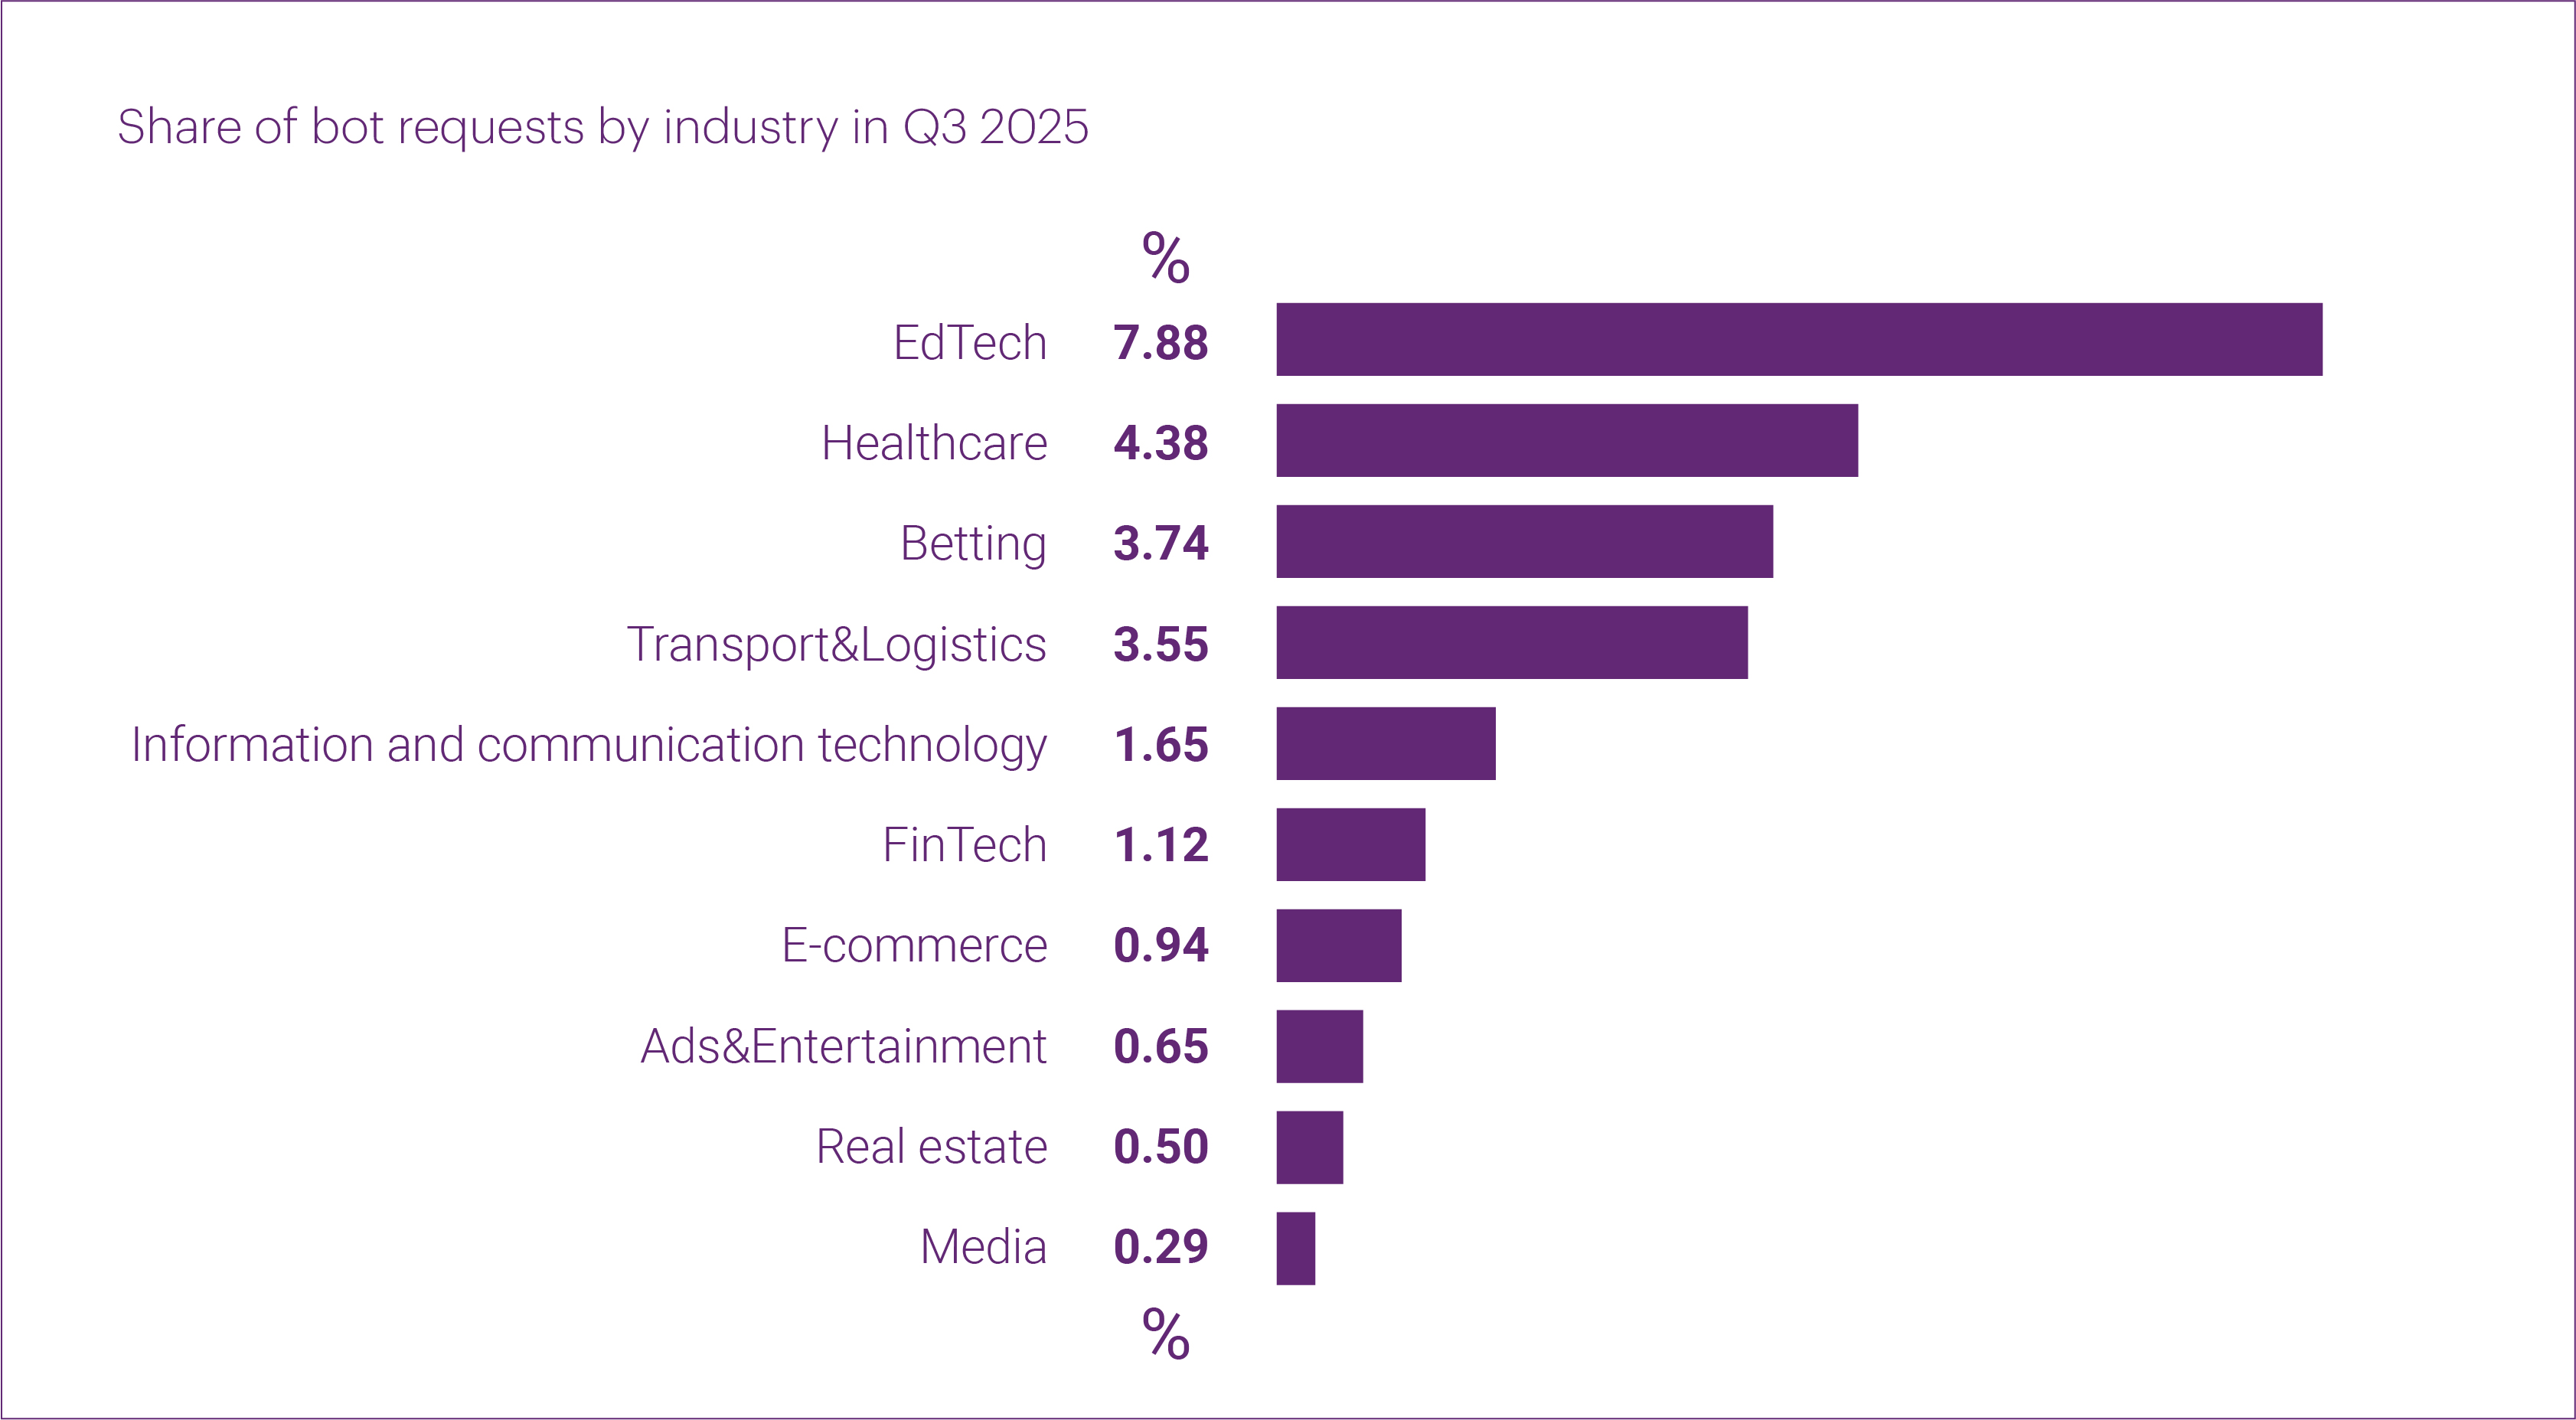
The bot index continues to vary across industries. The three segments most affected by bot traffic in Q3 were Digital education (7.88%), Healthcare (4.38%), and Betting (3.74%).
It should be noted that Qrator.AntiBot allows customers to configure on which pages and domains the protection is active. Therefore, a significant portion of bot traffic may not be reflected in this statistic.
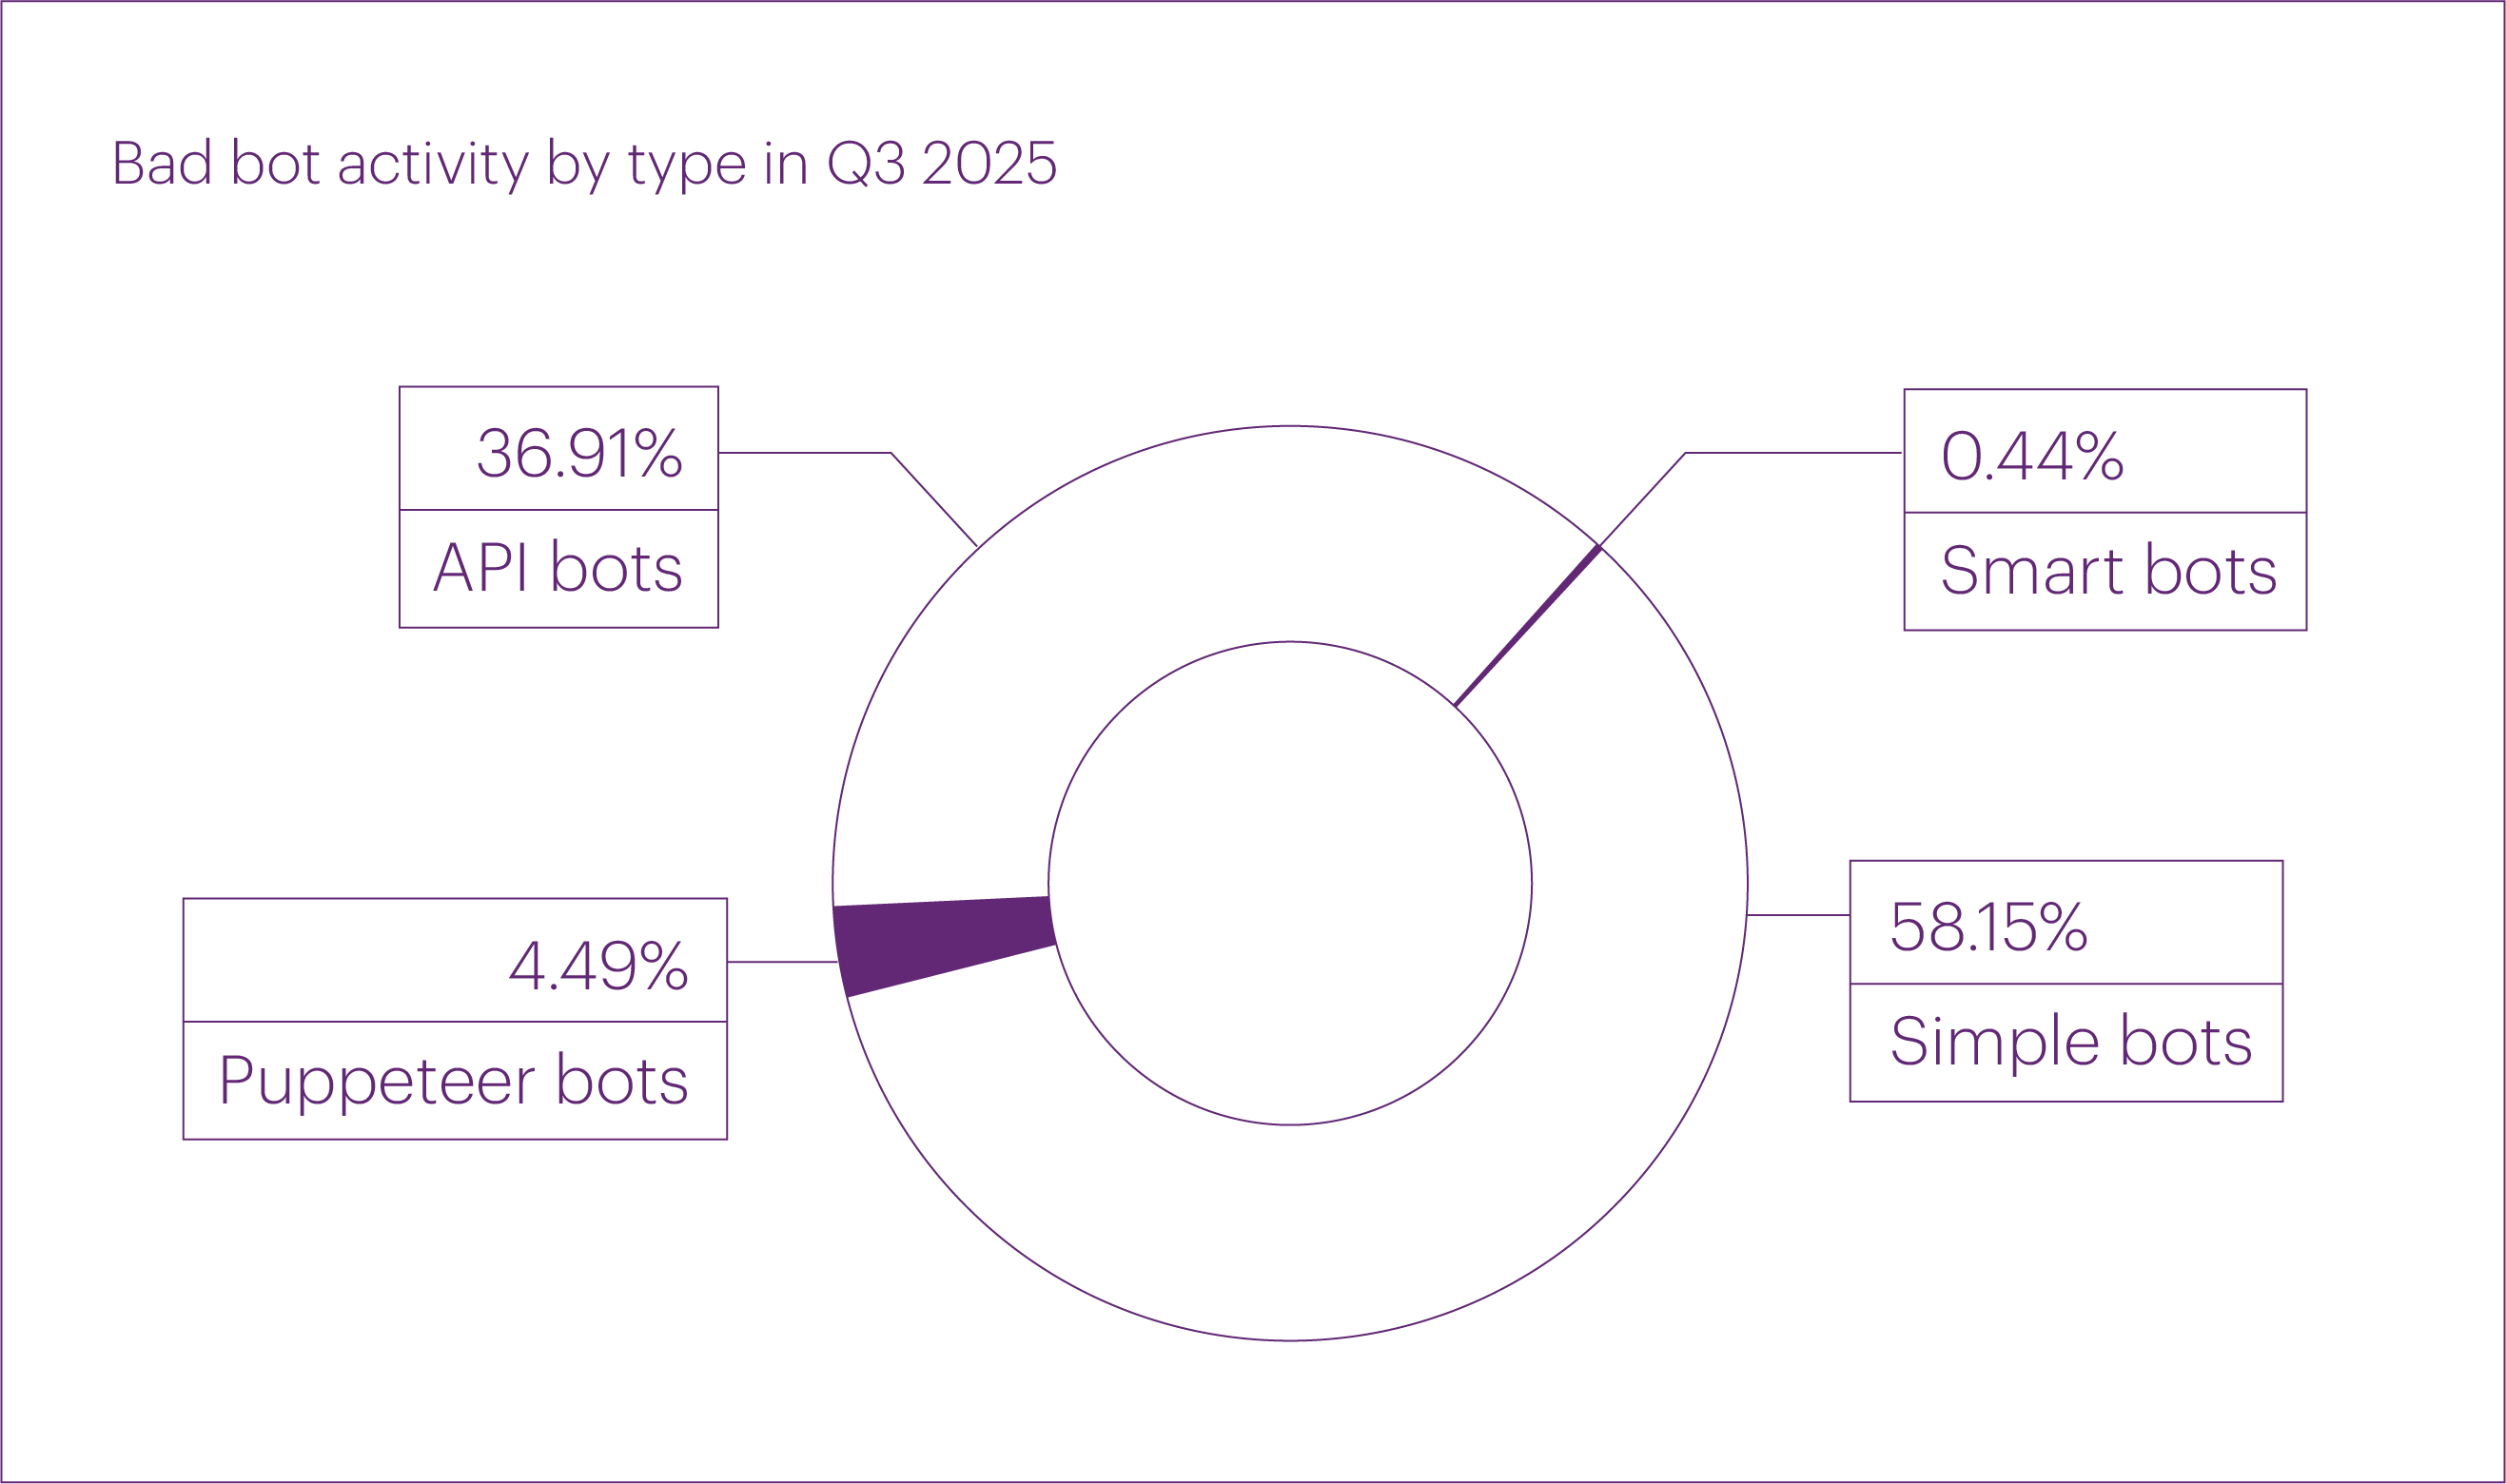
Since last quarter, we have refined our bot categorization, now distinguishing four types instead of three:
- Simple bots — scripts using cURL, Python, and other languages, without browser emulation.
- Puppeteer bots — bots that mimic a regular user environment but are externally automated.
- Smart bots — bots that are aware of bot checks and designed to bypass them.
- API bots — scripts that ignore normal user interaction and primarily target APIs.
As a result, the previously used category “browser bots” has been divided into two separate types — puppeteer bots and smart bots.
In Q3 2025, compared to Q2, the share of simple bots (59.18% → 58.15%) and API bots (38.01% → 36.91%) slightly decreased, while the share of puppeteer bots (2.58% → 4.49%) and smart bots (0.23% → 0.44%) nearly doubled.
Most notable bad bot attacks
The longest bot attack in Q3 occurred on September 4 and targeted an organization in the E-commerce segment. The attack lasted for 14 hours and 33 minutes, during which Qrator.AntiBot blocked a total of 9,276,340 bot requests.
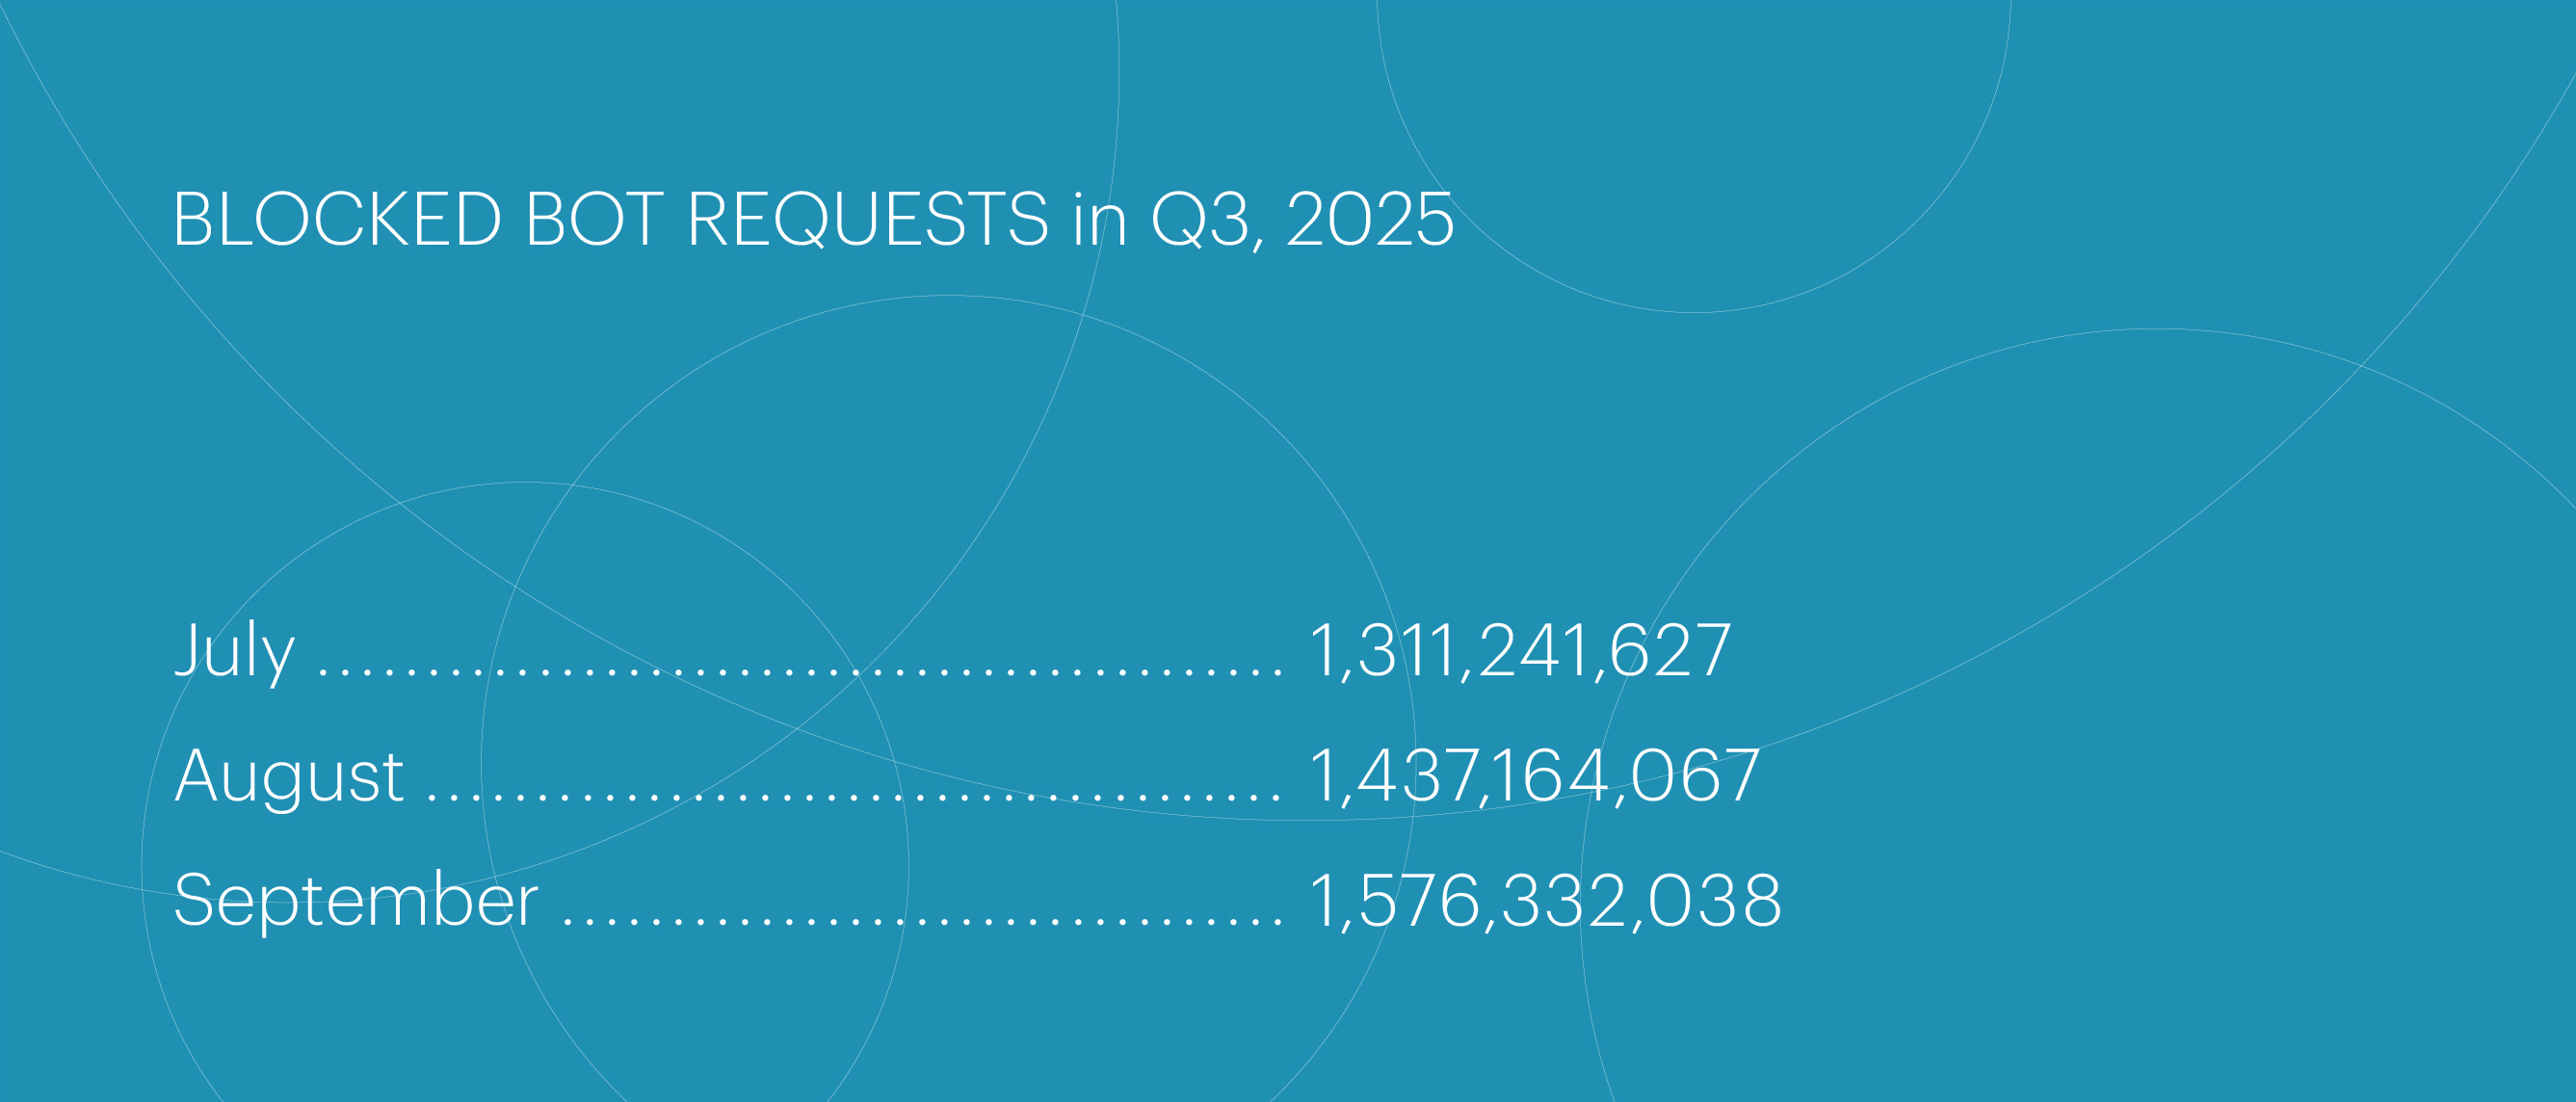
At first glance, this duration may seem modest. However, it represents only a single episode. In reality, bad bot attacks targeting this organization have been blocked continuously since the protection was enabled. For instance, over the past six months, bot activity across this organization’s resources has been as follows:
The most intensive attack of Q3 targeted another organization in the E-commerce segment. At its peak, the attack reached 210,725 malicious requests per second — nearly half the record set in the previous quarter (441,147 requests).
During this incident, the attackers first attempted to disrupt the resource using a TCP flood that peaked at 2.63 Gbps. When this L3-L4 DDoS proved ineffective, they switched to junk application-layer requests, which also failed to achieve their goal.
BGP incidents
The number of unique autonomous systems (ASes) responsible for route leaks in Q3 2025 remained roughly the same as in the previous several quarters. However, the number of unique ASes involved in BGP hijacks was slightly lower than in prior periods. This decrease in activity was primarily observed in July, while in August and September, the figures returned to typical levels.
Global BGP incidents
Note: The Qrator.Radar team identifies global BGP incidents using a set of threshold criteria. These include the number of affected prefixes and autonomous systems, as well as the extent of the anomaly’s propagation across routing tables.
After the sharp surge in global BGP incidents reported in Q2 2025, Q3 was significantly calmer. During this period, we recorded only five global incidents — four route leaks and a single BGP hijack.
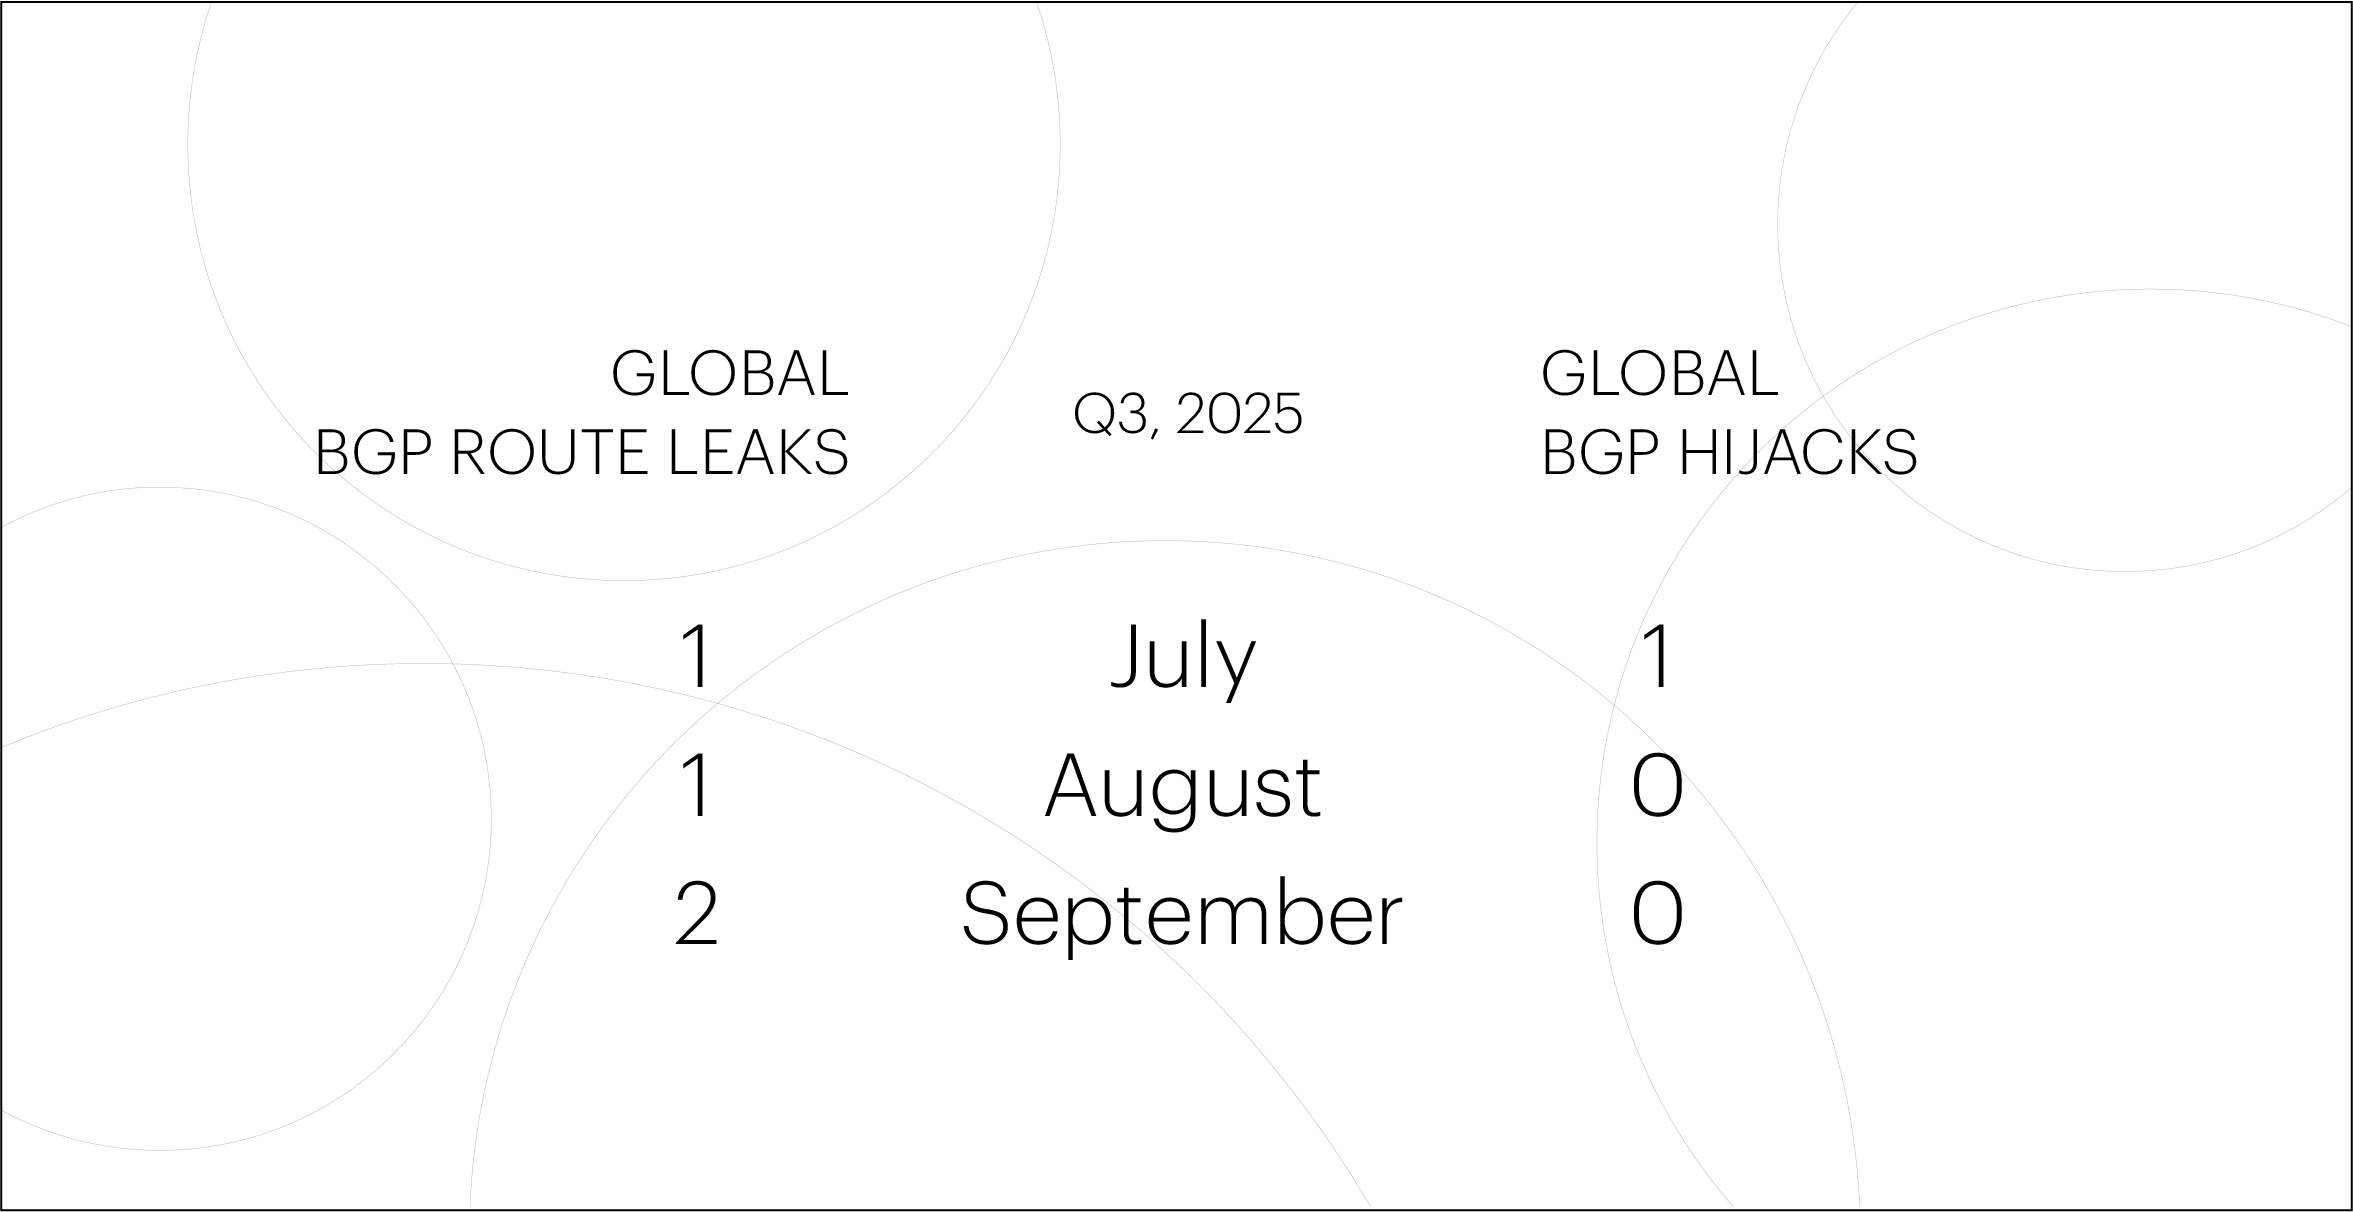
For comparison, in the previous quarter, we identified 14 global incidents — 10 route leaks and 4 BGP hijacks.
Detailed findings
- The most prevalent DDoS attack vectors in Q3 2025 were HTTP (73.9% of all attacks), UDP flood (12.3%), and IP flood (7.9%).
- ICMP flood attacks have completely fallen out of favor with attackers — not a single one was recorded throughout Q3.
- Multi-vector attacks accounted for 7.5% of all incidents in Q3. In about half of these cases (3.8%), L3-L4 DDoS was combined with L7 DDoS.
- In Q3, DDoS attacks most frequently targeted the FinTech (26.1%), E-commerce (22.0%), Media (15.8%), and Information and communication technology (14.5%) segments.
- Among microsegments, DDoS attacks in Q3 primarily targeted Media, TV, radio, and bloggers (14.1%), Payment systems (13.9%), Food retail (13.0%), Digital education (7.2%), and Hosting platforms (6.6%).
- The most intensive L3-L4 DDoS attack of Q3 targeted an organization in the Online retail microsegment, peaking at 1.15 Tbps — slightly higher than the 2024 record of 1.14 Tbps.
- The same attack also recorded the highest packet rate, reaching 174.7 Mpps at its peak.
- The three longest DDoS attacks in Q3 lasted 225.9, 119.2, and 17.7 hours, respectively. For comparison, the record attack in 2024 lasted nearly 19 days (463.9 hours).
- The largest DDoS botnet recorded in Q3 consisted of 5.76 million devices (for comparison, the largest botnet in 2024 included about 227 thousand). Most of the infected devices were located in Brazil (24.5%), Vietnam (11.5%), the United States (11.2%), India (7.1%), and Argentina (2.8%).
- In Q3 2025, Brazil became the leading source of L7 DDoS attacks (19%), with its share increasing significantly over the past year. As a result, Russia (18.4%) and the United States (10.3%) moved to second and third place, respectively.
- We attribute the growth of DDoS botnets and the rising share of developing countries among L7 DDoS sources to two converging factors. On one hand, there is a rapid increase in the number of Internet-connected devices with low security; on the other, attackers increasingly use AI-based tools to automate the discovery and compromise of such devices.
- Bad bot activity in Q3 2025 was significantly lower (-37%) than in the previous quarter, despite an increase in the number of protected resources.
- The largest number of bad bot attacks in Q3 2025 targeted the E-commerce (42.79%), Betting (21.71%), and Healthcare (17.52%) segments.
- On average, bot traffic accounted for 1.36% of total traffic to protected resources in Q3 2025. However, several segments showed significantly higher values, particularly Digital education (7.88%), Healthcare (4.38%), and Betting (3.74%).
- The number of unique ASes responsible for route leaks in Q3 2025 remained roughly the same as in the previous few quarters. The number of ASes involved in BGP hijacks was noticeably lower than usual, mainly due to reduced activity in July.
- The number of global BGP incidents in Q3 2025 dropped significantly compared to the previous reporting period. In total, we recorded five global incidents — four route leaks and one BGP hijack.