The National Internet Segment Reliability Research explains how the outage of a single Autonomous System might affect the connectivity of the impacted region with the rest of the world. Most of the time, the most critical AS in the region is the dominant ISP on the market, but not always.
As the number of alternate routes between AS’s increases (and do not forget that the Internet stands for “interconnected network” - and each network is an AS), so does the fault-tolerance and stability of the Internet across the globe. Although some paths are more important than others from the beginning, establishing as many alternate routes as possible is the only viable way to ensure an adequately robust network.
The global connectivity of any given AS, regardless of whether it is an international giant or regional player, depends on the quantity and quality of its path to Tier-1 ISPs.
Usually, Tier-1 implies an international company offering global IP transit service over connections with other Tier-1 providers. Nevertheless, there is no guarantee that such connectivity will be maintained all the time. For many ISPs at all “tiers”, losing connection to even one Tier-1 peer would likely render them unreachable from some parts of the world.
The Methodology of Internet Reliability Measurement
Examining a case when an AS experiences network degradation, we want to answer the following question: “How many AS’s in the same region would lose connectivity with Tier-1 operators and their global availability along with it?”
Throughout the years, we model such a situation because, at the dawn of BGP and interdomain routing design, its creators assumed that every non-transit AS would have at least two upstream providers to guarantee fault tolerance in case one of them goes down.
However, the current reality is different, with less than half of all ISPs globally having only one connection to an upstream transit provider. A range of unconventional relationships among transit ISPs further reduces availability.
Have transit ISPs ever failed? The answer is yes, and it happens with increasing frequency. The more appropriate question is - under what conditions would a particular ISP experience service degradation so severe we would call it an outage? If such problems seem unlikely, it may be worth considering Murphy’s Law: “Anything that can go wrong, will”.
We have applied the same model for the sixth year in a row to model such a scenario. Although again, we did not merely repeat previous calculations - the research is expanding over the years.
The following steps were taken to rate AS reliability:
For every AS in the world, we examine all alternate paths to Tier-1 operators with the help of an AS relationship model, the core of Qrator.Radar;
Using the Maxmind GeoIP database, we matched countries to every IP address of every AS;
For every AS, we calculated the share of its address space that corresponds to the relevant region. ISP’s were filtered out that reside at an Internet Exchange Point in a region where they do not have a significant presence. The example we are using here is Hong Kong, where traffic is exchanged among hundreds of members of HKIX - yet the biggest Asian Internet Exchange, most of which have zero presence in the local internet segment;
After isolating regional ASs, we analyzed the potential impact of one’s outage on other AS’s as well as their respective countries;
In the end, for each country, we identified the AS with the greatest/largest impact on other ASes in their region. Foreign AS’s were not considered.
We took that AS’s impact value as a reliability score for the country. And used that score to rate the reliability of countries. The less score is — the better reliability is.
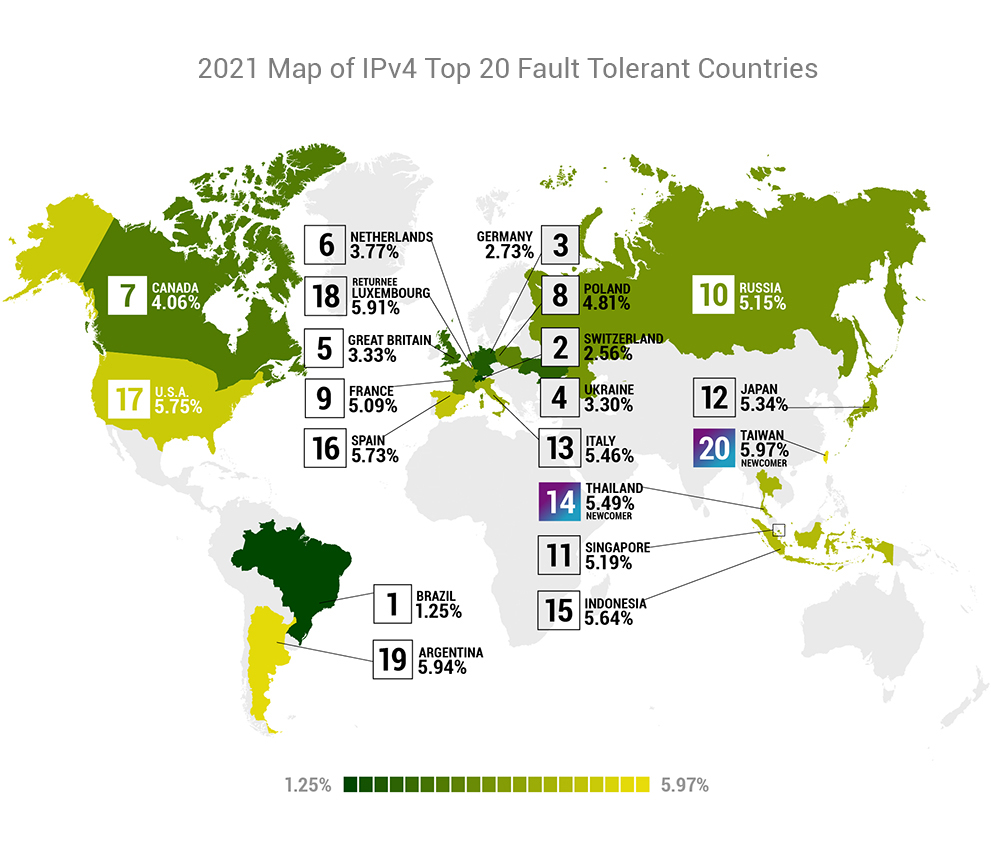
IPv4 Reliability
Highlights
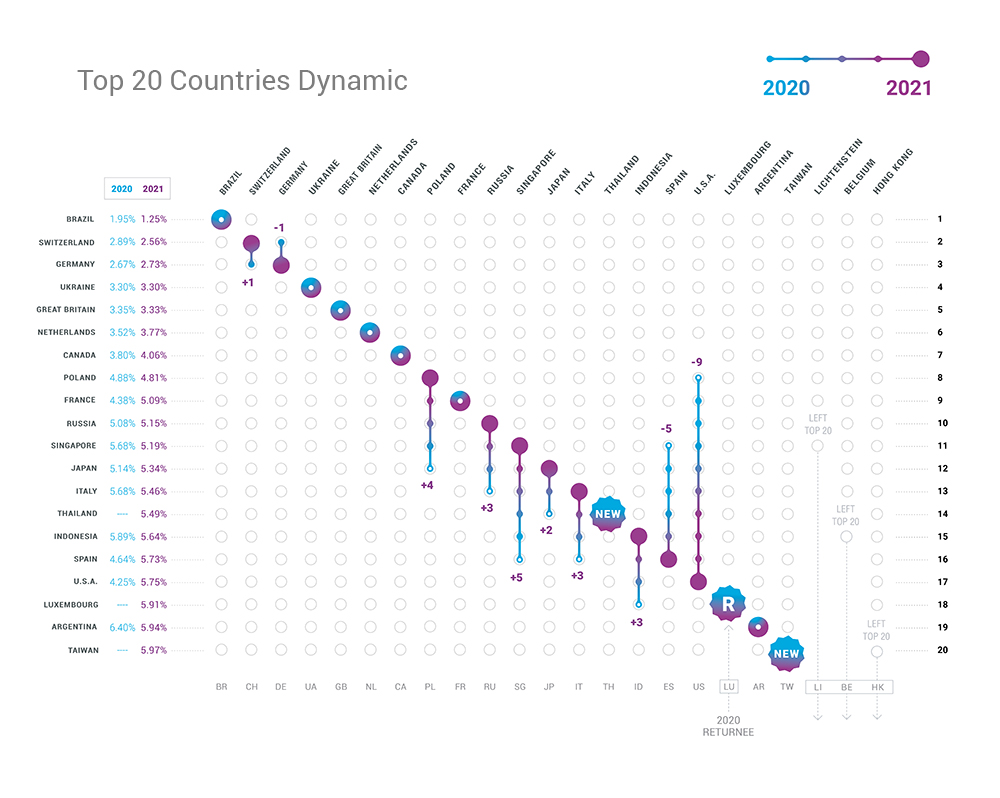
Comparing with 2020, in 2021:
Three segments left the top-20 of reliability rating: Lichtenstein, Belgium and Hong Kong;
The USA fell by 9 positions;
Singapore gained 6 positions;
Thailand and Taiwan entered the top-20 for the first time;
Luxembourg reappeared in the top-20 after falling out of it in 2020.
Every year exciting movements happen in the reliability rating, often corresponding to what is happening with the telecommunications industry inside the respective regions.
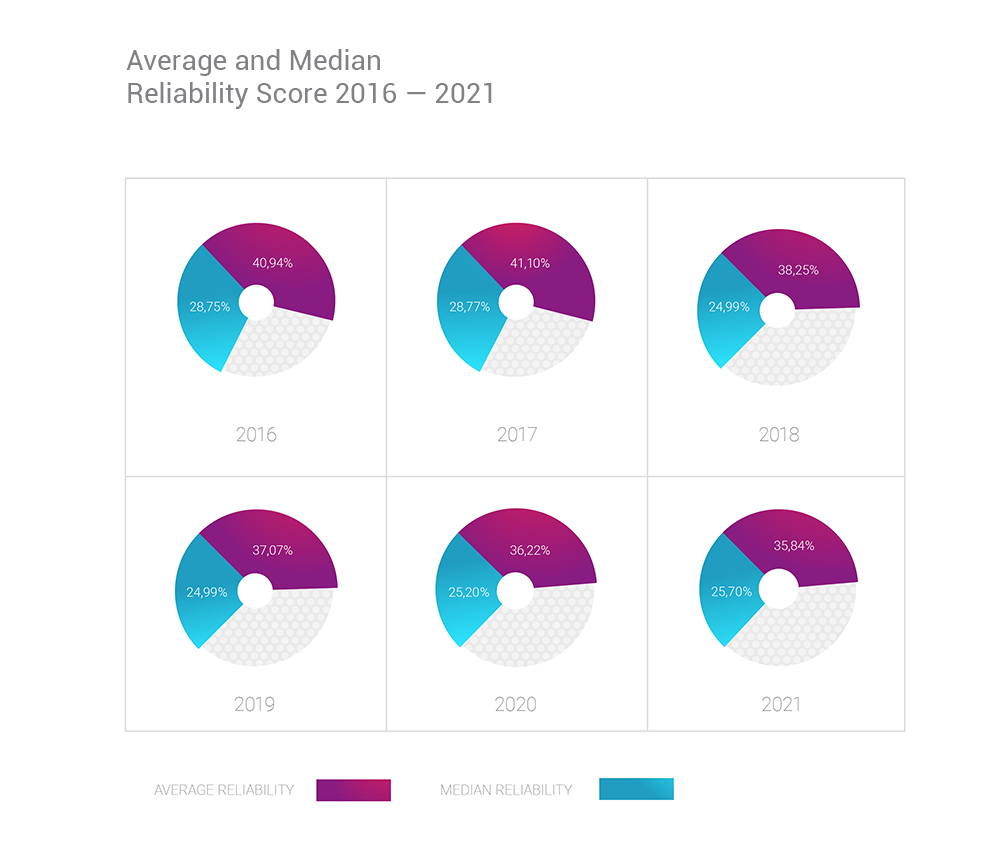
First things first - the overall trend in global reliability, counted as an average and medium. This time we are looking at the five years of continuous research.
Median reliability dropped slightly (by 0.50%) in 2021. Still, the average continues to improve globally over the last six years we’re doing this research.
In 2021 the number of countries that successfully improved reliability score to under 10%, indicating high fault tolerance, increased by 3 compared with 2020 results, reaching 43.
As you can also see, the average reliability score is improving over time. However, the median stays at comparable levels since 2018 - the latter part of the rating does not improve quickly enough compared with the upper half.
However, the most significant fact remains - for the period of our research, both IPv4 and IPv6 show significant improvements in reliability. Furthermore, there is an inevitable point in the future where the IPv6 version of the rating would become the primary one.
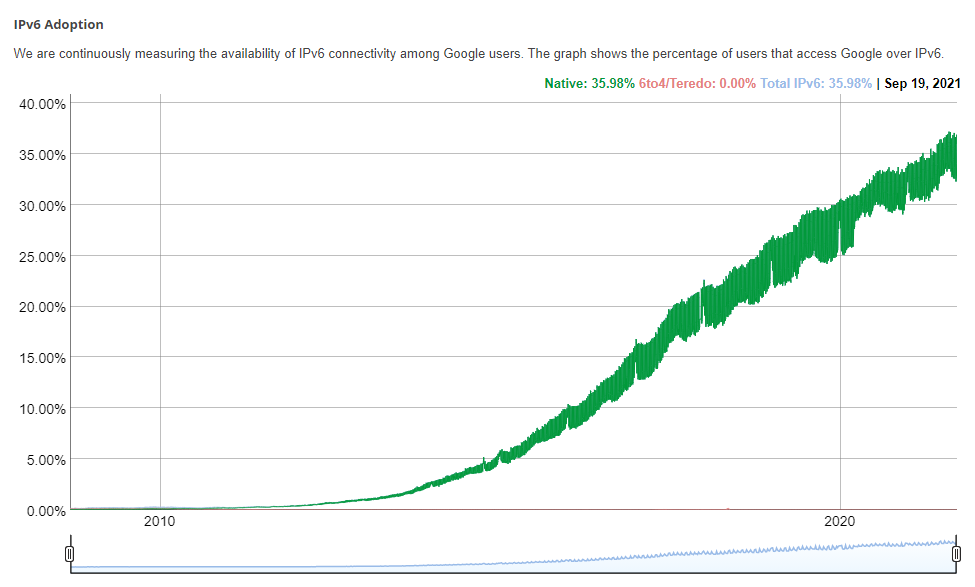
IPv6 Reliability
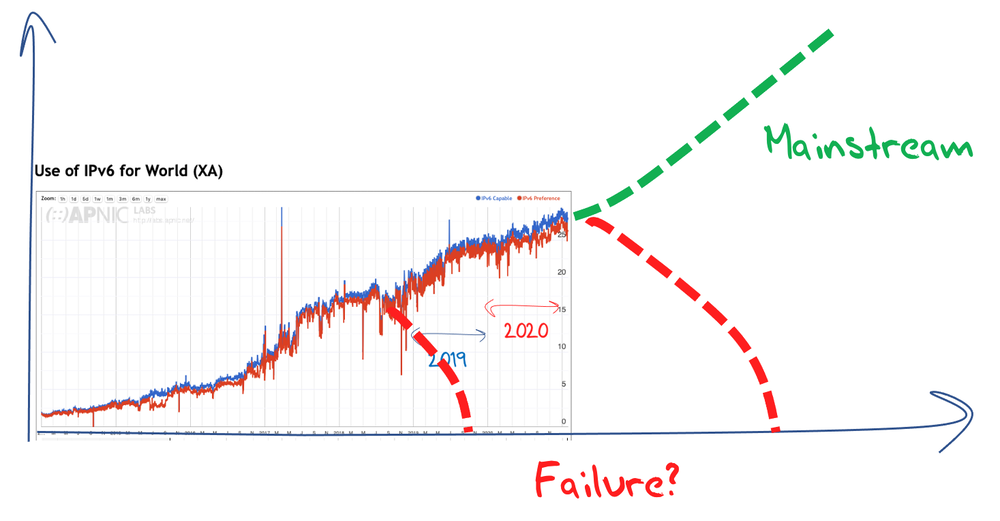
As usual, we should start from the Google-provided graphic of IPv6 adoption they measure in % of all sessions that are using IPv6 to connect to Google servers:
“The underlying question here is where are we on this adoption path? It could be that the inflection point for IPv6 adoption came and went some years ago, and IPv6 is now on a mainstream technology adoption curve. Given that adoption now encompasses some 30% of the Internet’s user base, this seems like a very reasonable interpretation of the data so far.
(credits: Geoff Huston, APNIC)
However, mainstream adoption often gathers momentum as it proceeds. If the decision to adopt makes sense for one mainstream provider, then the factors behind such a decision are similar for many, if not all, such providers. That would imply that a characteristic of mainstream adoption is some form of an exponential growth curve, where the momentum of adoption continues to increase in pace right up to the point of effective market saturation.
But that’s not what we see with IPv6 adoption. While there were the beginnings of strong growth in IPv6 adoption in what was visible in 2017, and again in 2019, in both cases the efforts failed to gather sustained momentum. That would imply that we have yet to reach an inflection point for IPv6 adoption and, despite the now solid adoption numbers, there is still some uncertainty as to the ultimate outcomes of this adoption effort.
This might seem to be a perverse interpretation of the data, but there are some factors that support such a conclusion.”
As of September 2021, approximately 36% of Google users use the native IPv6 connection, which effectively translates into their ISPs supporting the v6 version of IP protocol.
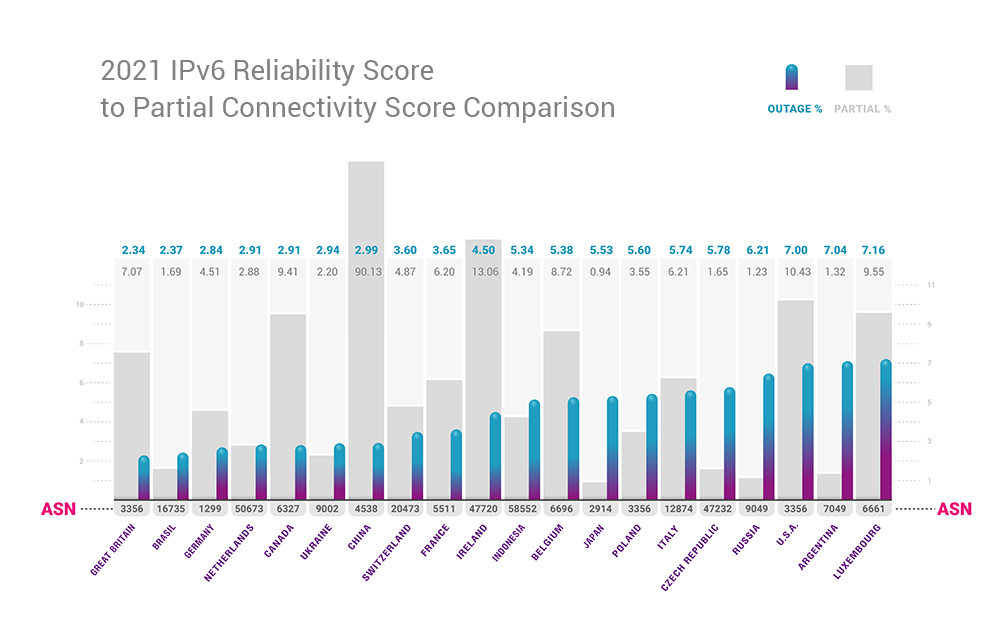
Although the main issue with IPv6 persists - that is the partial connectivity. Due to peering wars, not universal IPv6 adoption and other matters, IPv6 still has limited network visibility. To better understand this, take a look at the IPv6 reliability versus the partial connectivity rate.
It is evident from this IPv6 Top-20 Reliability to Partial Connectivity Comparison chart that there are several countries where the partial connectivity in IPv6 exceeds 10%: Ireland, U.S.A, Canada is close to 10%, as well as Luxembourg. However, the real elephant in the room is China, which entered the IPv6 reliability rating only in 2021, though right away in seventh place, but with an astounding 90% of partial connectivity. That is how China is implementing its national IPv6 adoption strategy; the only thing to look for in the future is actually resolving those partial connectivity issues soon enough. As we looked into it, AS4538, responsible for such a leap in the IPv6 rating, mainly serves as an upstream for universities and academic organizations throughout China.
Looking at the partial connectivity combined with the “classic” reliability percentage, showing the share of (at least partially) unavailable resources in case of an outage, we could state that, excluding China, the worst numbers belong among top-20 IPv6 reliable countries belong to Ireland (17.56%), USA (17.43%), Luxembourg (16.71%), Belgium (14.10%) and Canada (12.32%). In Brazil, the first country in IPv4 rating and second in IPv6, combined unavailability makes 4.06%, which isn’t bad for such a big country with a booming telecommunications market.
If you’re interested, India, the second largest country of the world deploying IPv6, is at place 87 of the IPv6 reliability, with AS9498 accountable for 23.67% of intrastate IPv6 resources unreachable in case of an outage.
The average IPv4 reliability score in 2020 is 35.84%. For IPv6, the same metric is at 25.57% - and as we measure the outage impact, the lower the metric is - the better. However, it is necessary to mention that the country adoption for IPv6 is twice as low as in the IPv4 case - the newer version of the protocol still has to go a long way to the total adoption.
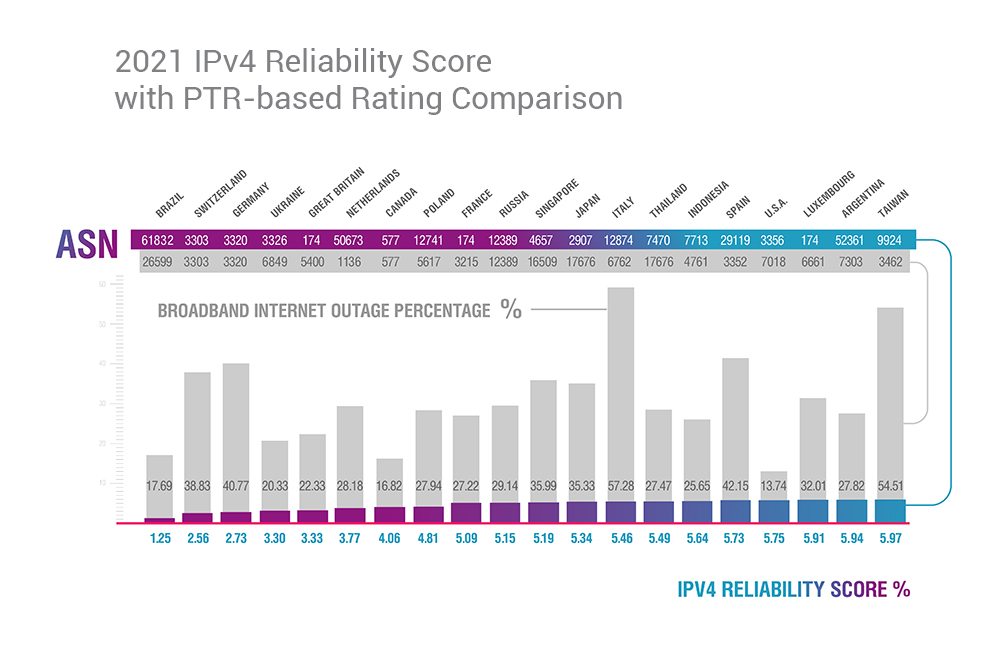
Broadband Internet and PTR records
“Does a country’s leading ISP always influence regional reliability more than everyone else?” - this is the question we are trying to answer with the help of additional information and investigation. We suggest that the most significant (by user base or customer base) ISP in a region is not necessarily the most critical for the region’s network connectivity.
Three years ago, we started to analyze the PTR records. Generally, PTR records are used for Reverse DNS lookup: using the IP address to identify the associated hostname or domain name.
Since we already know the largest AS’s for every country in the world, we could count the PTR records within their network and determine their share of overall PTR records for the corresponding region. We counted only PTR records and did not calculate the ratio of IP addresses without PTR records to IP-address with them.
So, we are speaking strictly of IP addresses with PTR records present. The practice of adding those is not universal; some providers do this, and others do not.
In the PTR-based rating, we look at what part of PTR-enabled IP addresses would go offline with an outage of each country’s AS and the percentage representing the relevant region.
Such an approach that considers PTR records yields very different results. In most cases, not only does the primary regional AS change, but the percentage is entirely different. In all of the generally reliable (from the global availability point of view) regions, the number of PTR-enabled IP addresses that shut down following an outage of one autonomous system is dozens of times higher. That could mean that the leading national ISP always handles end-users at one point or another.
Thus, we should assume that this percentage represents the part of the ISP’s user base and customer base that would go offline (if switching to a second internet service provider were not possible) in the event of an outage. From this perspective, countries appear to be less reliable than they look from the transit point of view. We leave possible conclusions from this PTR-enabled rating to the reader.
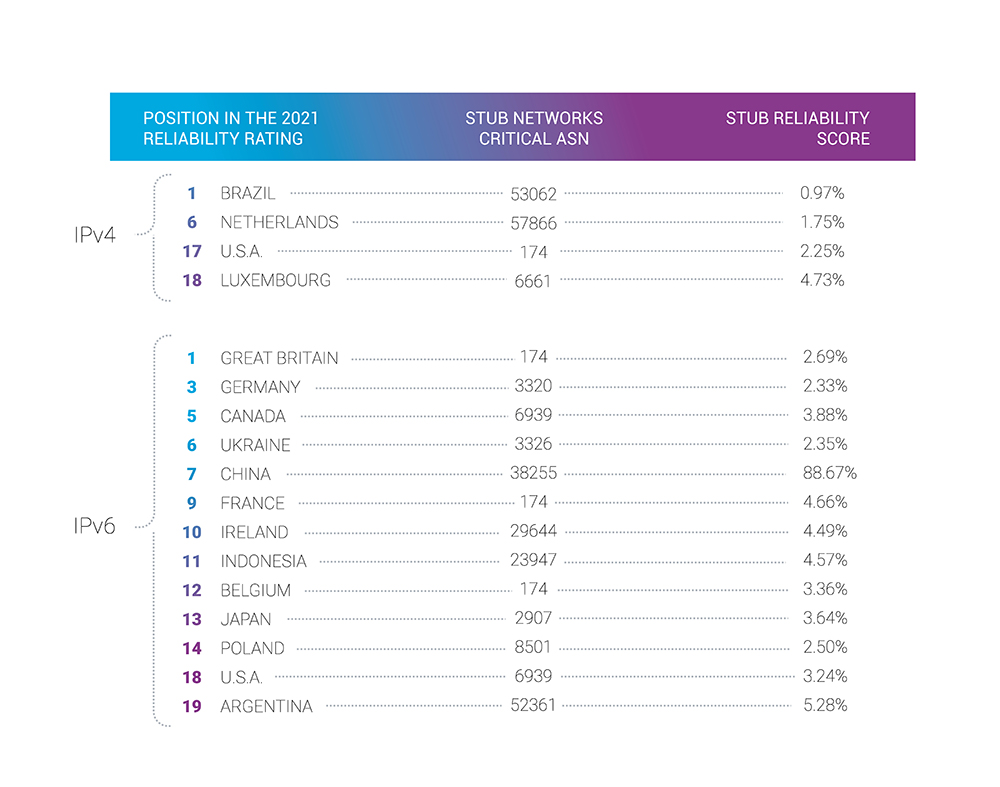
ISPs With Only One Upstream (Stub networks) and Their Reliability
In seven out of the top twenty IPv4 Reliability Rating countries, we found a peculiar detail. Suppose we look for the largest provider for “stub networks”, which are essentially networks with only one upstream provider. In that case, we will find another AS and ISP, different from the one responsible for the current classical reliability metric for the corresponding national segment.
So let us take a look at the most visible differences between the critical AS in terms of global transit versus the primary upstream choice in a specific region. Interestingly, rarely a critical AS for stub networks would not be the classical global critical AS simultaneously.
Here we highlighted the countries from both the top of IPv4 Reliability Rating and IPv6 Reliability Rating for 2020.
AS174 - Cogent - is notable in IPv4. Cogent’s dynamics is always interesting to investigate. As a Tier-1 with a strong presence in Europe, it has a tremendous responsibility. It is also critical AS for IPv4 stub networks (the USA is the most significant example) and the global transit. In 2021 it is critical AS for IPv6 stub networks in Great Britain, France and Belgium. In IPv4, Cogent is responsible for all the reliability metrics (global and stub) in Great Britain, France and Luxembourg (from the IPv4 top 20).
AS6939 - Hurricane Electric - is the stub networks’ critical autonomous systems in Canada and the USA for IPv6.
AS3356 - Level3 - is the global critical autonomous system in IPv6 for Great Britain, Poland and the USA.
Those are big fish, but not too big to fail in terms of reliability. Moreover, continuing centralization of networks in the larger economies poses a particular challenge to the region's reliability score, which we see, especially in the case with the United States.
As always, our closing note would be the same - in order for any national segment (country), city, business and even end-user to have an acceptable level of reliability - it is necessary to have at least two upstream providers.
Thank you for reading the Reliability Research! In case you have any questions, feel free to contact us on radar@qrator.net.