The year 2023 turned out to be quite rich in events and trends in the field of cybersecurity. We witnessed a new term "white noise", the development of artificial intelligence led to increased bot activity, which significantly affected commercial companies. We detected signs of a resurgence in popularity of commercial DDoS attacks. The implementation of "remote office" technologies led to the expansion of communication channels and, as a result, increased intensity of attacks. But first things first.
DDoS Attacks by Vectors
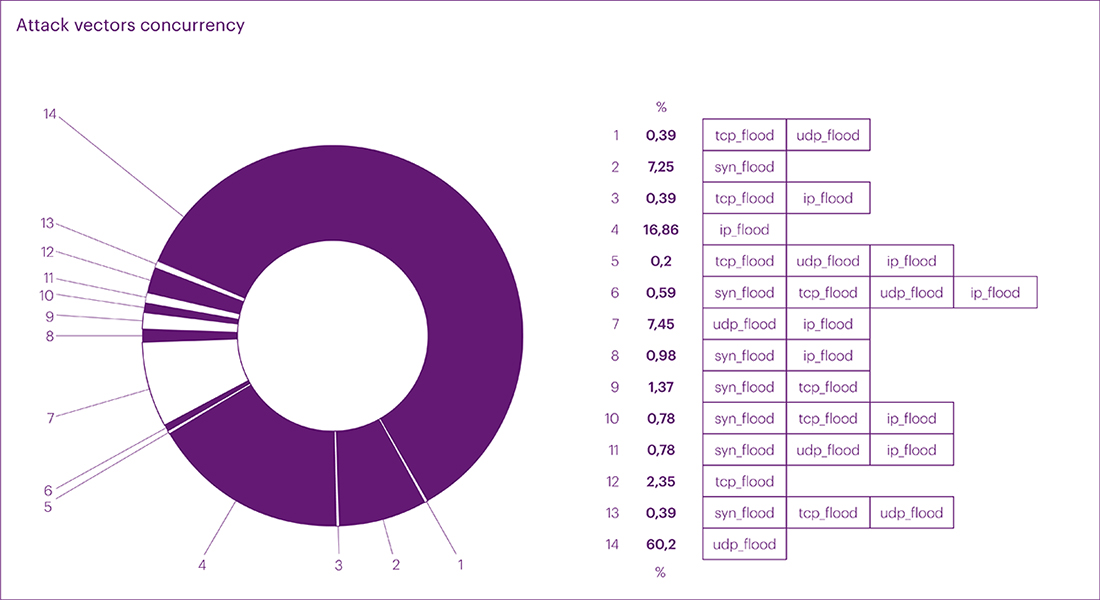
The fourth quarter of the past year didn't bring any surprises in terms of the distribution of mixed attacks by vectors. UDP flood once again topped the list with a rate of 60.20%. IP flood came in second at 16.86%. Multivector attacks also made it into the top three with 13.36%. Overall, the distribution was as follows:
- UDP flood - 60.20%
- SYN flood - 7.26%
- IP flood - 16.86%
- Multivector attacks - 13.36%
In terms of net vector distribution statistics in the fourth quarter, the positions were slightly different:
- UDP flood - 59.77%
- SYN flood - 10.85%
- IP flood - 23.87%
- TCP flood - 5.51%
As a result, the annual attack vector statistics were distributed as follows. In mixed values, UDP flood led, followed by SYN flood, and multivector attacks:
- UDP flood - 54.99%
- SYN flood - 13.89%
- Multivector attacks - 13.53%
- IP flood - 10.31%
- TCP flood - 7.28%
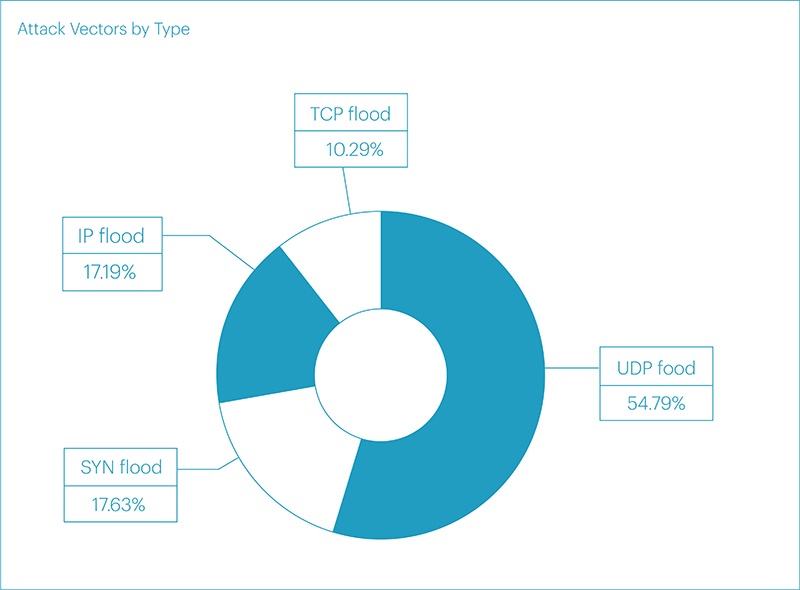
Net vector attack values were distributed in the same way as mixed values, except for multivector attacks:
- UDP flood - 54.79%
- SYN flood - 17.63%
- IP flood - 17.19%
- TCP flood - 10.29%
Throughout 2023, we observed a trend of consistent growth in UDP flood attacks. As you may recall from previous reports, we identified three main reasons for this:
- Firstly, the change in infrastructure for most businesses and the transition to UDP with the DTLS protocol to enhance performance and scalability.
- Secondly, the expansion of internet channels amidst the evolving format of remote offices and the implementation of additional communication tools.
- Thirdly, a shift in the behavior pattern of malicious actors who started using UDP as a cheaper and easier-to-organize method of attacks more frequently.
Clearly, as channel bandwidth increases, so does the intensity of attacks. By the end of the year, this led to minor traffic spikes with low intensity no longer surprising or causing harm, instead resembling "white noise." This prompted us to conclude the need for a change in the methodology of collecting and analyzing attack data. New criteria will allow us to discard insignificant traffic and focus on more impactful incidents. Starting from the first quarter of 2024, the new data analysis methodology will be used in our reports.
Duration and bandwidth of attacks by vectors and segments
The duration of attacks in the fourth quarter did not set any new records. The longest continuous attack of 2023 remains the incident from the third quarter – an attack on the Airports segment (Transport and Logistics Macro-segment). The multivector attack, relatively small in volume, peaking at just 5.94 Gbps (UDP flood), began on August 24th simultaneously from three vectors: TCP flood, which lasted one day, UDP and SYN flood, lasting until August 27th. In total, the attack lasted almost three days (71.58 hours of UDP flood and 70.73 hours of SYN flood simultaneously). According to our estimates, this attack exhibits signs of a commercial (ordered) DDoS attack.
The second longest continuous duration attack occurred in the first quarter of the year on the Banks segment (Financial Technologies). The total duration of the attack was over 42 hours. Closing the top three leaders is an attack on online stores in the E-commerce segment, which occurred in the fourth quarter and lasted almost 30 hours.
At the end of the year, the ranking of continuous attack durations by segments is as follows:
- Transport and Logistics: Airports - 71.58 hours
- Fintech: Banks - 42 hours
- E-commerce: Retail - 29.98 hours
- Fintech: OFD - 22.59 hours
- Fintech: Payment systems - 21.78 hours
- Gaming platforms - 20.7 hours
- Online education - 20.27 hours
- Online media - 20.05 hours
- E-commerce: Travel services - 12.04 hours
- IT and Telecom: Online services - 10.70 hours
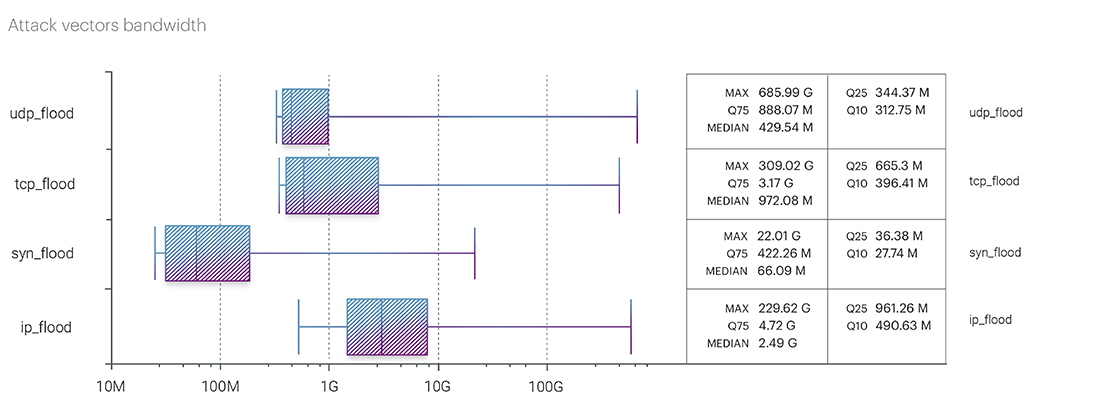
As for the intensity rating of attacks, the top spot was taken by an incident from the first quarter. An attack with a peak intensity of over 690 Gbps occurred in the Food retail segment. The second spot in the ranking was an attack with an intensity of 685.99 Gbps in the form of UDP flood on the gaming platform segment of Online Gaming. Rounding out the top three leaders is an attack on a hosting provider in the IT and Telecom segment with an intensity of 675 Gbps. The Media segment also made it into the top 5:
- E-commerce: Food retail - 690.24 Gbps
- Gaming platforms - 685.99 Gbps
- IT and Telecom: Hosting provider - 675 Gbps
- Online games: Game servers - 551.52 Gbps
- Media: Social networks - 368.2 Gbps
The rating of attack bandwidth by vectors at the end of the year looks as follows:
- UDP flood - 690.24 Gbps
- IP flood - 607.76 Gbps
- TCP flood - 471.21 Gbps
- ICMP flood - 114.65 Gbps
- SYN flood - 22.01 Gbps
The distribution of continuous attack durations by vectors at the end of the year favored UDP and SYN floods, which took the first and second spots respectively, with durations of 71.58 hours and 70.73 hours (we mentioned this attack earlier in the Transport and Logistics segment):
- UDP flood - 71.58 hours
- SYN flood - 70.73 hours
- IP flood - 22.22 hours
- TCP flood - 13.29 hours
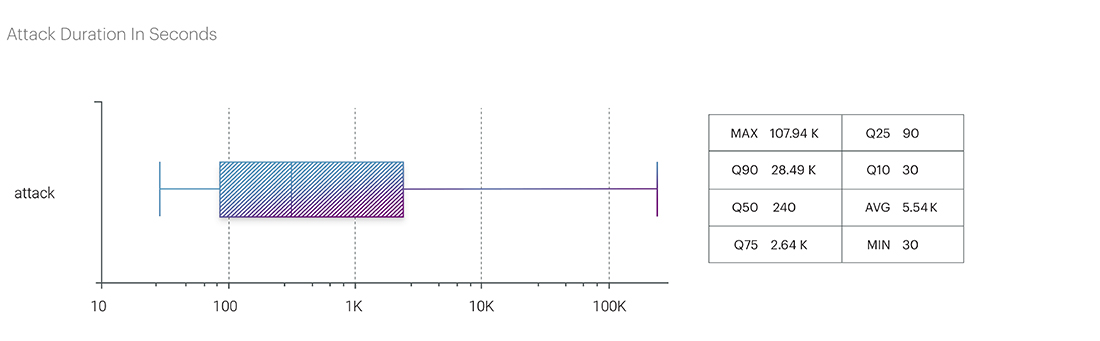
The average duration of attacks at the end of the year was 1.3 hours.
The longest intermittent attack at the L3-L4 levels was recorded in the Online Gaming segment. The attack, targeting the same domain, began on July 26th and ended on August 1st, lasting a total of one week. The breaks between traffic surges were no more than 15 hours. At the peak bitrate, the attack reached 183.43 Gbps, and the packet intensity was 15.49 Mpps. In August, another online gaming platform was subjected to several attacks, peaking at 99.54 Gbps. The attacks were conducted on the same domain with intervals of several days (from August 12th to 29th) using different vectors (UDP + SYN + IP). The average bitrate of the attacks was 25.58 Gbps.
A series of attacks in the IT and Telecom segment targeting a hosting platform deserves special attention. The multivector attack began on August 20th, and until September 1st, traffic was arriving in relatively small volumes with breaks of one to two days. Then there was a two-week hiatus, and on September 14th, the domain was attacked simultaneously in four vectors with peak loads: UDP – 675.22 Gbps, IP – 607.76 Gbps, ICMP – 114.65 Gbps, TCP – 55.14 Gbps.
All these attacks can be characterized as commercial. Commercial attacks this year regained popularity due to the expansion of communication channels, the transition to new protocols to optimize the operation of remote offices, and as a result, the ease and low cost of organizing network attacks. Interestingly, to circumvent geoblocking, malicious actors have become more active in using local sources of traffic, as close as possible to the region of their victims.
The distribution of attacks by segments in the fourth quarter showed that towards the end of the year, attackers more often targeted companies in the E-commerce sector - 40.70%. In second place with a share of 29.04% was the Financial sector. The top three leaders also included the Educational Technologies segment with a share of 7.77%. However, descending to the micro-segment level, the picture looks different:
- Financial sector: Banks - 22.09%
- E-commerce: Online bulletin boards - 20.04%
- E-commerce: Online retail - 20.25%
- Educational Technologies: Online education - 6.95%
- Financial sector: Payment systems - 6.34%
At the end of the year, as can be seen from the ranking, Banks, Online bulletin boards, and Online retail were most often targeted by attackers. Obviously, this is a result of pre-New Year seasonal offerings in these segments.
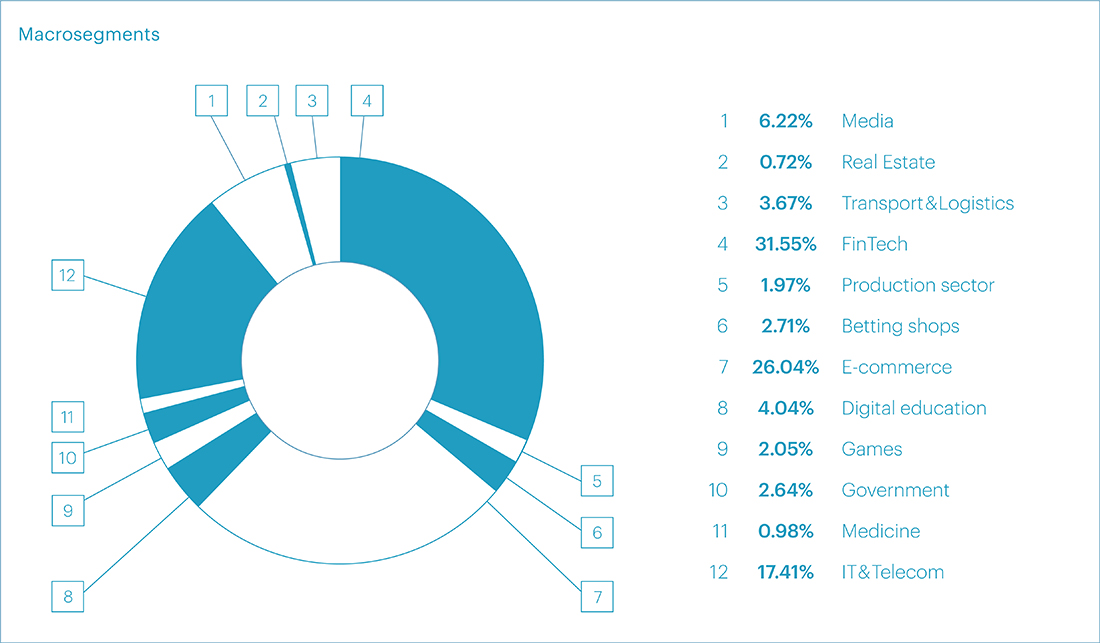
The picture looks similar at the end of the year. In 2023, attackers most often targeted the Financial Technologies sector – 36.88%. The E-commerce segment took the second place with a share of 24.95%. The top 5 also included segments of Educational Technologies, Online Gaming, and IT and Telecom:
- Financial Technologies - 36.88%
- E-commerce - 24.95%
- Educational Technologies - 9.86%
- Online Gaming - 7.34%
- IT and Telecom - 6.01%
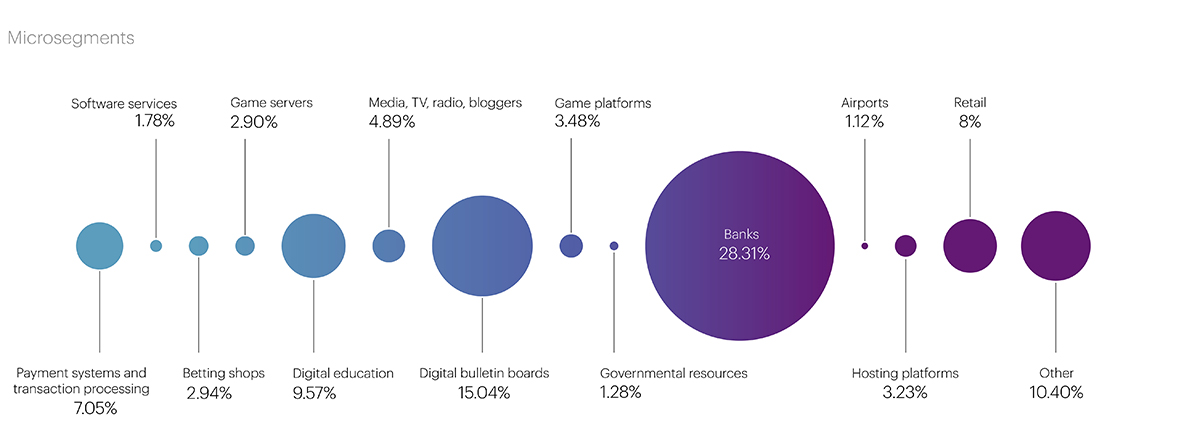
At the micro-segment level, the main targets of attackers were Banks – 28.31%, which traditionally come under attack during periods of active promotion of seasonal banking products – loans and deposits. Online bulletin boards – 15.04%, Educational platforms – 9.57%, Online stores – 8%, and Payment systems – 7.05% were also included in the top 5 which is not surprising. The development of e-commerce recently has been immense. Today, most goods and services can be obtained online. Furthermore, as we have mentioned several times before, the expansion of communication channels, the transition to new protocols to optimize the operation of remote offices, and the ease and low cost of organizing DDoS attacks have led to a resurgence in the trend of commercial attacks which are an effective influencing businesses tool used by malicious actors, with all that implies.
Geographical Distribution of Attack Sources
The statistics on the distribution of attacks by geographical sources in the fourth quarter once again highlight the trend that has progressed throughout 2023: malicious actors have successfully learned to bypass GeoIP blocking, and a significant portion of attack traffic is now generated by local sources, as close as possible to the regions of their targets.
The total number of blocked IP addresses increased by 32.15% compared to the third quarter, from 40.15 to 53.06 million. This is the highest rate for 2023.
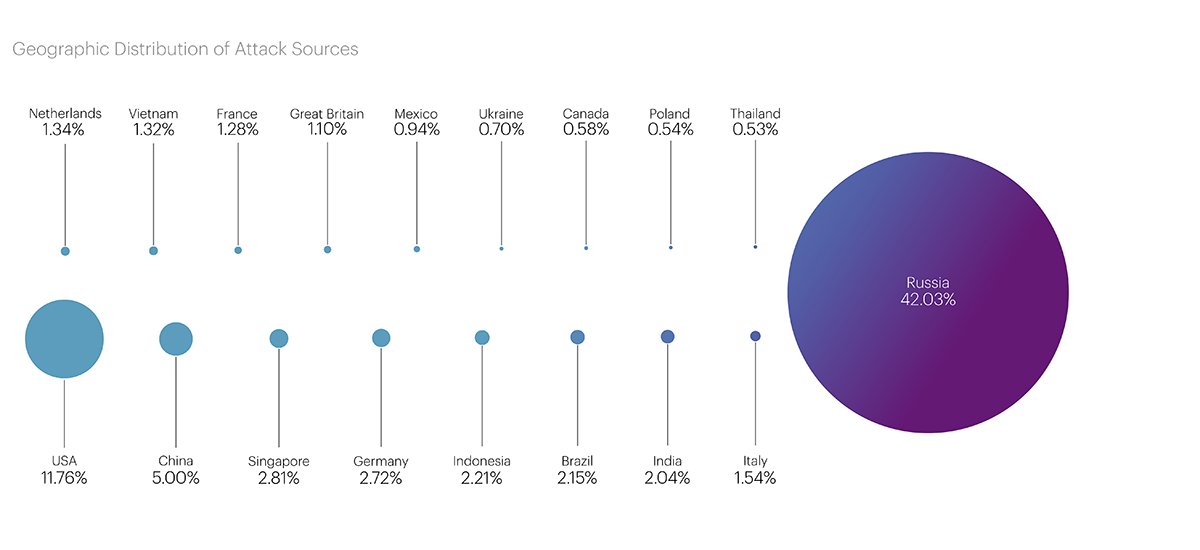
As before, Russia topped the list of the Top 20 in the fourth quarter, where 22.3 million addresses were blocked (42.03% of the total). The United States and China again entered the top three with 6.23 (11.76%) and 2.65 (5%) million blocks respectively.
The list of main leaders also did not undergo significant changes. It still includes Singapore (1.49 million), Germany (1.44 million), Indonesia (1.17 million), Brazil (1.14 million), and India (1.08 million). However, France left the Top 10 in the fourth quarter, where the number of blocked addresses decreased from 822 thousand to 679 thousand, and its place was taken by Italy (819 thousand).
The Netherlands, Vietnam, the United Kingdom, and Mexico became newcomers to the list in this quarter with the number of blocked IPs being 709 thousand, 702 thousand, 586 thousand, and 501 thousand respectively.
The Largest Botnet
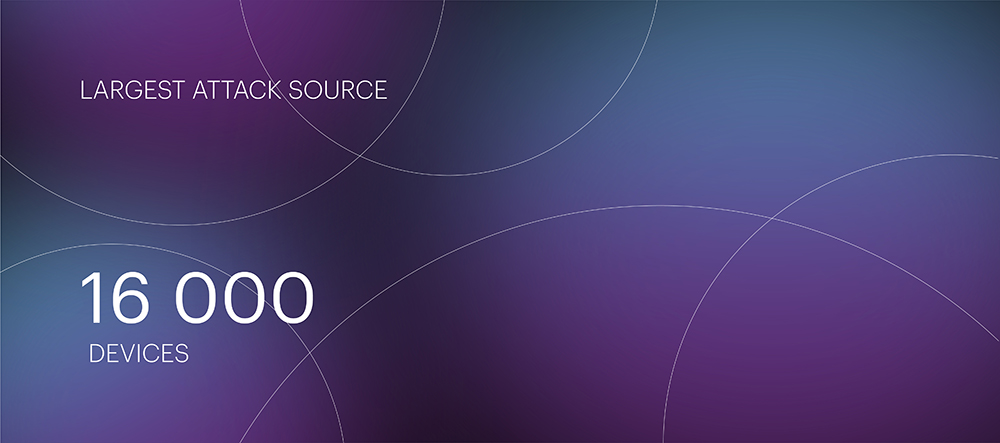
The largest botnet in the fourth quarter turned out to be the smallest throughout 2023 – only 16 thousand devices from 133 countries. Recall that in the third quarter, this figure was 85,298 devices, and the largest botnet for the entire year was recorded in the second quarter – 135,590 devices.
The botnet attack in the fourth quarter occurred on October 20 in the Payment Systems segment. The largest number of botnet devices was recorded in the United States – 6,952 devices. Italy (3,394 devices), Indonesia (937 devices), South Korea (936 devices), and Russia (839 devices) also made it to the top 5.
Application Layer Attacks (L7 OSI Model)
In the fourth quarter of the past year, the volume of attacks at the application level increased by almost 19%, but it still remains at a relatively low level, lower than the indicators at the beginning of the year. This is not surprising and should not mislead the reader. The relatively small number of attacks – more than 13 thousand for the past quarter, and slightly over 60 thousand attacks for the entire year – does not mean that this level of the OSI model is being ignored by malicious actors. On the contrary, the small volume of attacks is compensated by their quality. All attacks are well-prepared and have a narrowly targeted nature, meaning that the attackers carefully select their targets and plan the attacks.
The reason for this is that to increase the number of attacks at the L7 level vulnerabilities are needed, as we have discussed before, allowing for the creation of inexpensive L7 attacks with the ability to generate a large number of requests per second. Without them, the cost is very high and often unjustified (expensive rental of botnets from real devices).
On the other hand, it is possible to generate a large number of requests from a small number of devices if the infected devices are powerful enough to generate from several hundred to several thousand requests each.
Moreover, as we have already noted, with the advent of the new version of the HTTP/2 protocol, it has become possible to generate hundreds of requests within one TCP session, simultaneously targeting different elements of the attacked resource. In the new protocol, there are almost no limitations on the number of requests within one TCP session, allowing malicious actors to remain relatively unnoticed at the provider level (L3-L4) protection, and even behavioral analysis at the L4 level cannot always identify such attacks, considering it normal protocol behavior.
As a result, 2023 was a landmark year in terms of application-level attacks. They have become more targeted and well prepared. Their sole purpose is not always just denial of service of the victim's resources. For example, with L7 attacks, malicious actors can force the victim's resources to horizontally scale. Often, such attacks are organized against companies renting servers in the cloud. By formal criteria, the victim's resources do not degrade during the attack, as with an increase in traffic volume, the server instantly scales and does not allow for service denial. However, over the period of time, this can result in significant financial losses for the customer, as the cost of resource utilization in the cloud can increase the bill several times.
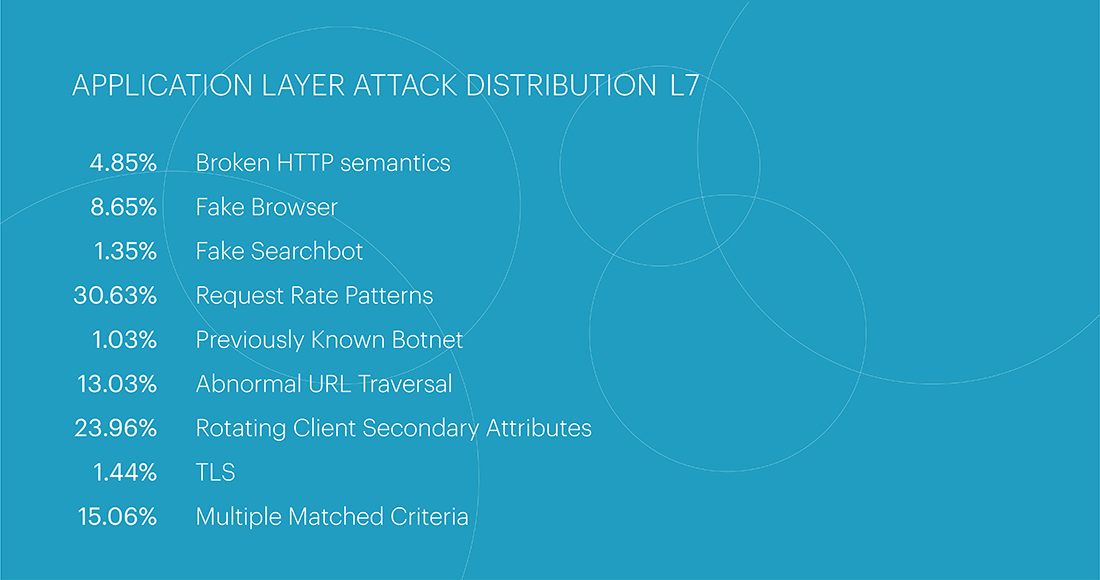
The list of the most popular attack classes has seen a change in leadership. The Request Rate Patterns class – indicators that deviate from the expected behavior of a legitimate user in terms of request frequency – accounted for 30.54% of all attacks. The change in leadership does not result in a significant increase in the Request Rate Patterns class, as its share compared to the previous quarter increased by only 4.72%. The significant decrease in the share of the Rotating Client Secondary Attributes class – an unusual set of headers in a request – explains the change in leadership. The leader of the previous quarter dropped to the second position with a rate of 21.39%, which is 11.58% less than the previous quarter's rate. The top three also include multi-class attacks, combining two or more classes - 16.53%. Their share increased by 4% from the previous quarter.
At the end of the fourth quarter, the Request Rate Patterns class – indicators that deviate from the expected behavior of a legitimate user in terms of request frequency – became the most popular again, accounting for 29.01% of all attacks. The top three also include the Rotating Client Secondary Attributes class (an unusual set of headers in a request) – 23.44%, and Multiple matched criteria (multi-class attacks) - 17.72%, Abnormal URL Traversal – 13.40%.
At the end of the entire year 2023, the Request Rate Patterns class remained the leader among the most popular classes with a share of 30.63%. As expected, the Rotating Client Secondary Attributes class ranked second with 23.96%. Closing the top three, as in the quarterly rating, was Multiple Matched Criteria – 15.06%.
The longest continuous attack in the fourth quarter was an attack on the Media segment. It lasted 76.8 hours with an intensity of 429 requests per second. The same attack also became the longest continuous attack for the entire 2023.
The second longest attack in the fourth quarter was recorded in the E-commerce (B2B) segment – 49 hours with an intensity of 851 requests per second. In both cases, the attacks were multi-class (involving two or more classes).
The average duration of attacks at the application level in the fourth quarter was about 10 minutes, with an average intensity of 4.9 thousand requests per second (the same as in the third quarter), and an average number of devices involved in the attack of 1,332.
The top continuous attacks for the year were as follows:
- Media - 76.8 hours
- E-commerce - 73.06 hours
- Financial technologies (payment systems and exchanges) - 22.15 hours
The longest intermittent attack for the year was recorded in the fourth quarter in the E-commerce segment (Online bulletin boards). The multi-class attack occurred from October 4th to December 29th. Attacks on the same domain occurred with intervals ranging from 1 to 12 days. In total, 79 attacks were recorded with an average duration of 45 seconds, an average request rate of 257 thousand per second, and an average of 44.7 thousand devices involved in the attack. One of the attacks in this series also became the most intense – at its peak, the attack reached 745.8 thousand requests per second, with the highest number of devices being 132.5 thousand.
The second most intense attack in the fourth quarter was in the Financial Technology segment (Payment Systems) – 260.9 thousand rps. The third place took IT and Telecom (Hosting Platforms) – 125.4 thousand rps at its peak.
For the year, the ranking of attacks by intensity at the application level was as follows:
- E-commerce (Online bulletin boards) - 978.4 thousand rps
- IT and Telecom (Hosting Platforms) - 445.7 thousand rps
- Financial technologies (payment systems) - 287.9 thousand rps
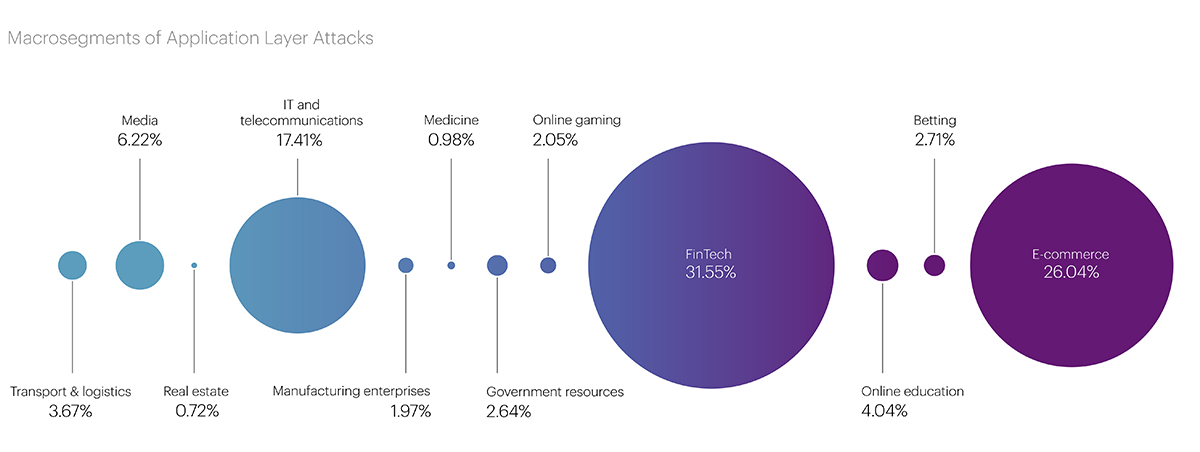
As for the distribution of attacks by segments, in the fourth quarter, the Financial Technologies segment topped the list of the most attacked, with a share of 37.58%, followed by the E-commerce segment at 20.26%. The IT and Telecom segment closed the top 3 with 18.12%.
The same pattern was registered in terms of the entire 2023, with Financial Technologies at 31.55%, E-commerce at 26.04%, and IT and Telecom at 17.41%.
At the micro-segment level, in the fourth quarter, attackers most often targeted Banks (14.85%). Just slightly behind, at 14.28%, were Payment Systems. Online retail closed the top three with a share of 9.65%. IT services and Hostings took the fourth and fifth place, respectively, with minimal difference – 8.75% and 8.17%.
According to the year results, the top 5 most attacked micro-segments were Payment Systems – 12.81%, IT services – 11.85%, Food Online Retail – 11.43%, Online retail – 10.76%, and Banks – 10.56%.
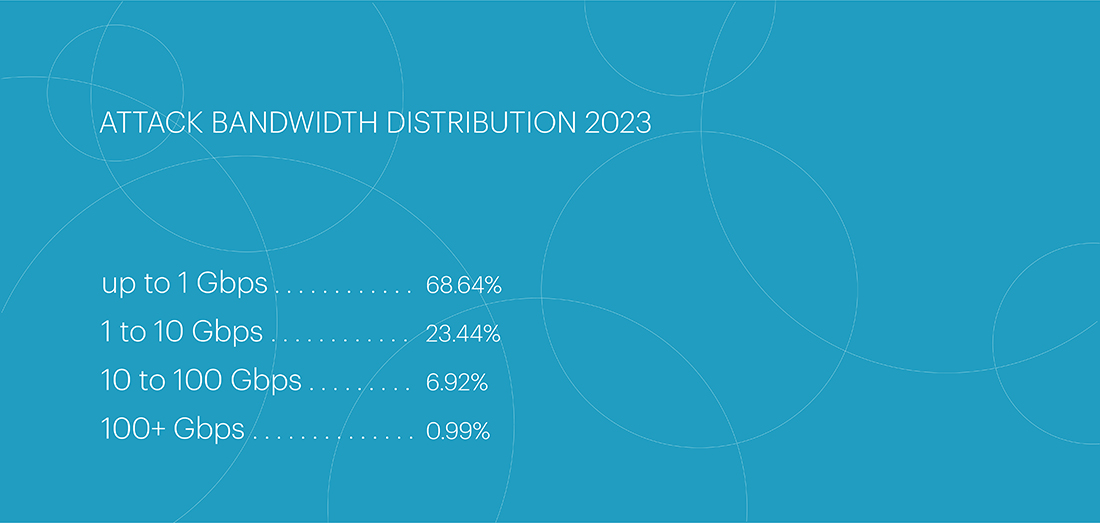
There were a large number of low-intensity attacks at the L7 OSI level throughout the year. Specifically, the majority of attacks – 68.64% – had an intensity of less than 1 Gbps. Attacks with intensities ranging from 1 to 10 Gbps accounted for 23.44% of the total, while 6.92% were attacks with intensity ranging from 10 to 100 Gbps. Attacks exceeding 100 Gbps accounted for only 0.99% of the total.
Bot Protection Statistics
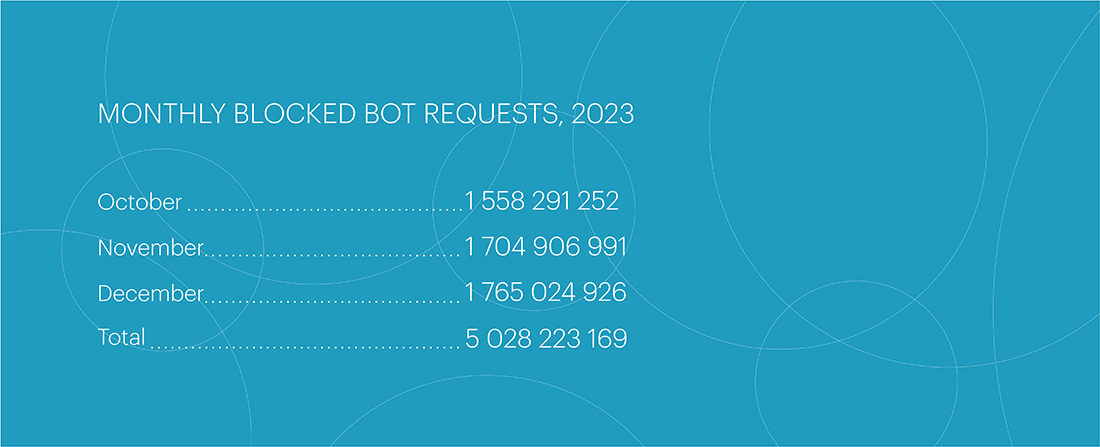
The fourth quarter became the peak period of 2023 in terms of bot activity. Its indicators almost doubled the number of bot attacks in the first quarter, increasing from 3,027,064,142 to 5,028,223,169 requests. Compared to the third quarter, the number of bot attacks also significantly increased – by 32%. December became the most active month of the fourth quarter, accounting for 1.77 billion blocked bot requests.
Throughout 2023, the share of online retail in the total bot activity increased, rising from 16% to almost 30%. This is primarily due to the growing interest of bot operators in this sphere and the overall increase in bot activity. Additionally, AI bots are most active in the retail sector, as it contains the most interesting content for them.
In addition to the overall increase in activity, online retail set records for the largest incidents related to bot attack spikes from the second to the fourth quarters. In this segment, two most noticeable incidents of the fourth quarter occurred. The largest bot attack with 30,527,990 requests was recorded on December 13, and the fastest attack happened on November 3 during the busiest sales period. The attack speed reached 51,200 bot requests at its peak (RPS), which is four times higher than the fastest attack in the second quarter, also occurring in the e-commerce segment.
In comparison, there are no such spikes in the betting sector: the load is more even there. However, this segment continues to hold the top positions, reaching a share of 30.9% of all bot requests in the fourth quarter. The pharmaceutical segment somewhat stabilized after a spike in the third quarter: bot activity in it decreased by 25%.
The main trend of 2023 is the growth of retail activity both in terms of overall indicators and individual major incidents.
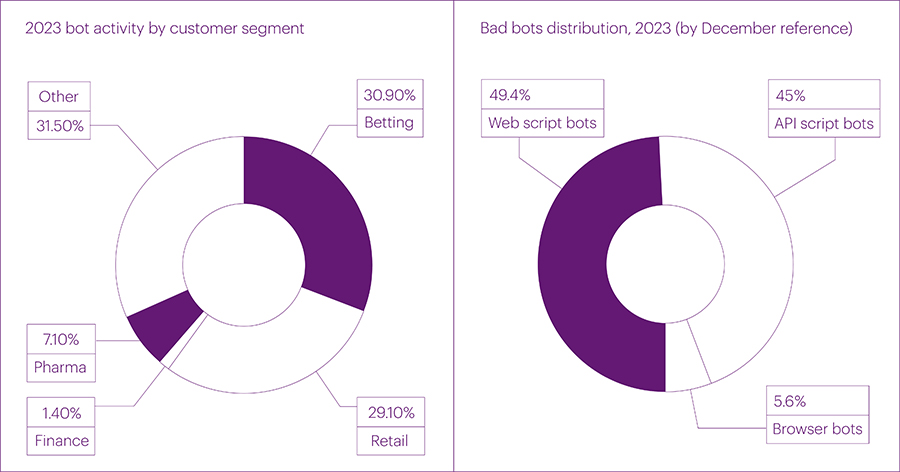
In terms of exploited methods of bot distribution, the fourth quarter saw the largest changes in the number of web scripts – primitive bot requests to web pages (49.4%) - and complex requests from browser bots (5.6%). Their number sharply increased compared to the third quarter and reached the maximum for the entire 2023. In the fourth quarter, for the first time, the number of requests to web pages exceeded the volume of bot activity on mobile APIs. In absolute terms, the number of API requests from bots significantly decreased compared to the third quarter – from 69% to 45%, and in December, it almost halved compared to September. Since AI bots, especially GPTbot, are primarily interested in web content, this provides a significant increase in script and browser bots on the web.
Perhaps the decrease in bot operators' interest in mobile APIs attacks is the beginning of a new major trend, but this will only become clear in the perspective of 2024.
BGP Incidents
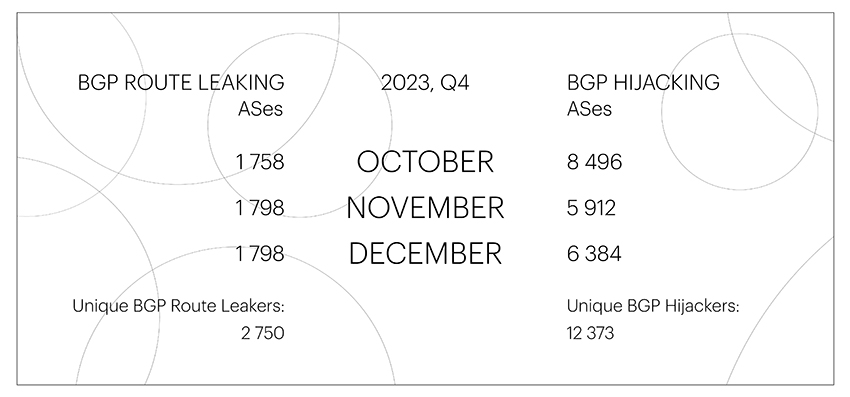
The number of unique autonomous systems involved in Route Leaks remained approximately at the same level throughout 2023, undergoing minor changes within one hundred – an average of about 1,800 per month.
The same can be said for the number of unique autonomous systems conducted BGP Hijacks: there have not been particularly strong spikes in this area during 2023. BGP Hijackers reached their maximum figures in October, increasing to 8,496. However, we have noted an increasing trend in the number of unique ASes involved in BGP Hijacks by the end of the year for three years now, which is not surprising: the end of the year is always characterized by a surge in activity in many spheres, including BGP.
As in the third quarter, at the end of the year we continued to record massive BGP Hijacks for IPv6 networks of the Chinese AS4538, carried out using ASes from the registered range.
Global BGP incidents
The Qrator.Radar team has a set of specific threshold values that distinguish global incidents from all others. These include the number of affected prefixes, autonomous systems, and the extent of anomaly distribution across routing tables.
The number of global Route Leaks in the fourth quarter remained at the same level as in the previous period – 6 per quarter, meanwhile global BGP Hijacks were not registered at all.
| Global BGP Route Leaks | Global BGP Hijacks |
| October: 1 November: 3 December: 2 |
October: 0 November: 0 December: 0 |
Throughout 2023, we almost haven’t witnessed global BGP Hijacks: their maximum number (2) was recorded in the first quarter. During the same period, there was observed the maximum number of global Route Leaks – 9 per quarter.
The full description of all incidents by their occurrence date can be found on the Qrator.Radar Twitter feed.