The second quarter of 2021 was expected to be much quieter than the Q1 in DDoS attacks; hence we're looking at the late spring and early summer months of April, May and June, with somewhat cooled business buzz globally. Although, some attacking activity was in place during the European Football Championship in June-July, focusing mainly on the betting industry.
We're here to disclose available details of DDoS attacks statistics and BGP incidents for Q2, 2021.
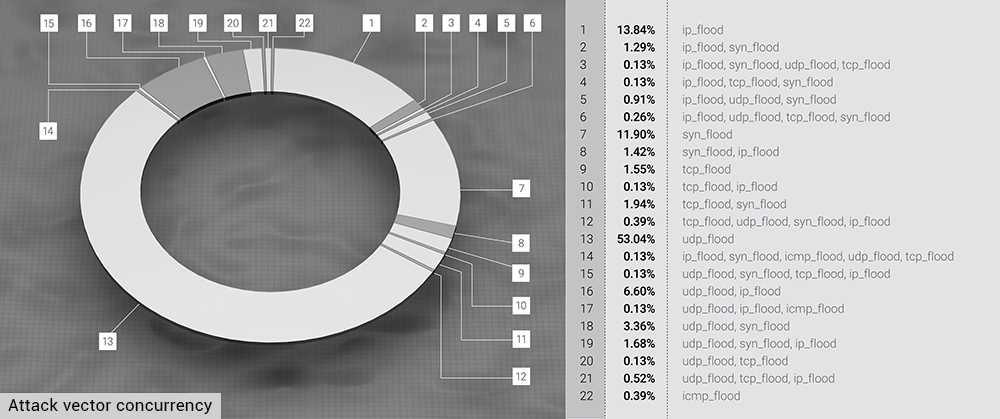
The top-3 attack vectors in Q2 were UDP flood, accounting for more than half of the Q2 attacks - 53,04%; then the IP flood with 13.84%, and finally, the SYN flood that amassed 11.90% of the episodes within a given quarter.
Compared with the Q1 statistics, where we had a third of all the attacks following into the IP flood section, in Q2, they switched places with UDP, and the UDP flood proportion grew substantially. Now three major "clear" vectors are UDP, IP and SYN floods, accounting for 78% of all Q2 DDoS attacks.
The most significant mixed vector - combined UDP and IP flood, in Q2, made only 6.6% of the total attacks, falling from 11.37% in Q1.
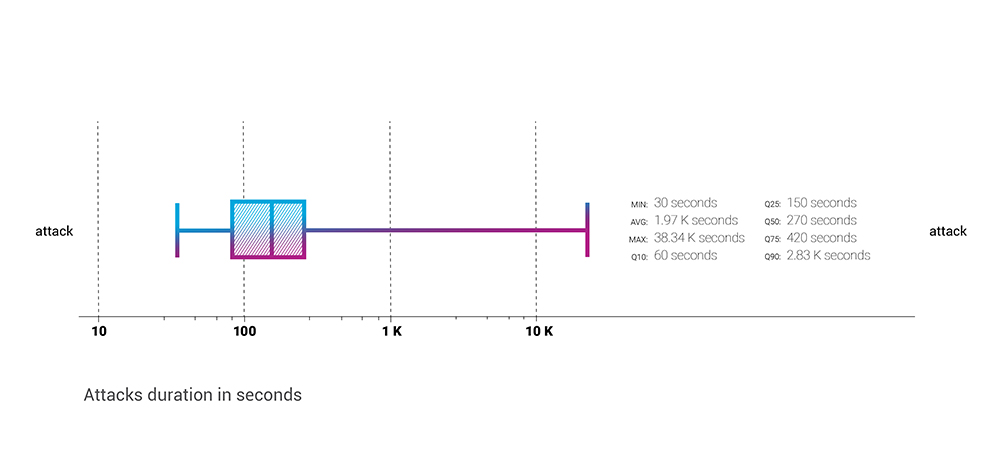
In Q2, the median attack time was 270 seconds, close to our observations for the previous year - 2020, when that metric equaled 300 seconds. It also means that compared with Q1, the median attack time had significantly risen - from 180 seconds.
The average attack time experienced even more substantial gain - from ~700 seconds in Q1 to almost 2k seconds in Q2, almost x3 in average attack duration.
Looking at different percentiles, we see that longer attack duration was almost a unified rule for the attacks of Q2, 2021. Compared with Q1, in Q2, even the shortest attacks doubled in duration.
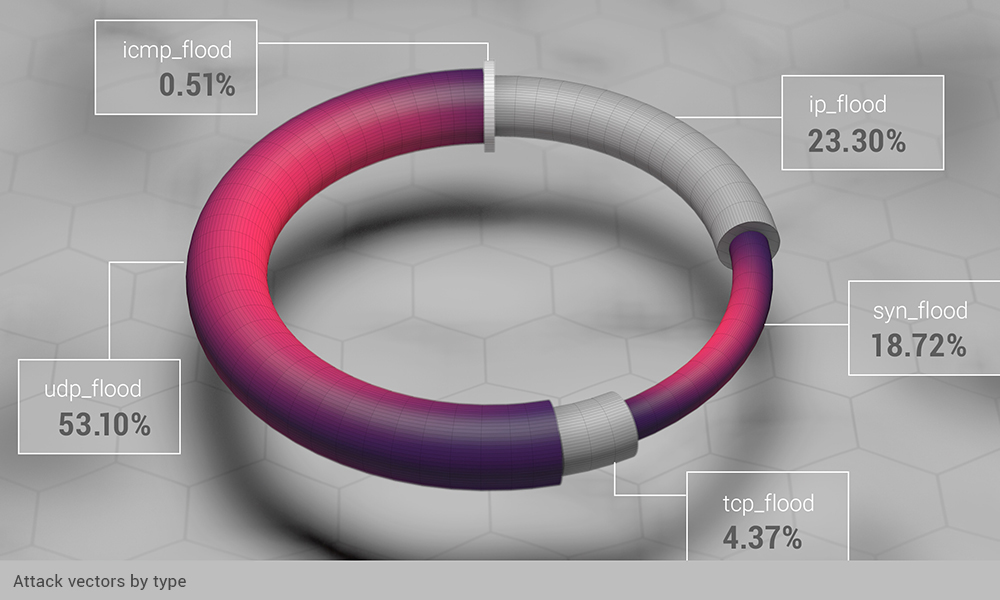
As we already mentioned, there was a change in the distribution of attack vectors. UDP flood grew 23%, while IP flood fell by 17%, SYN flood by ~2.5% and TCP flood by 4%. All those attacks that accounted for those vectors a quarter ago now switched to exploiting the UDP flood vector.
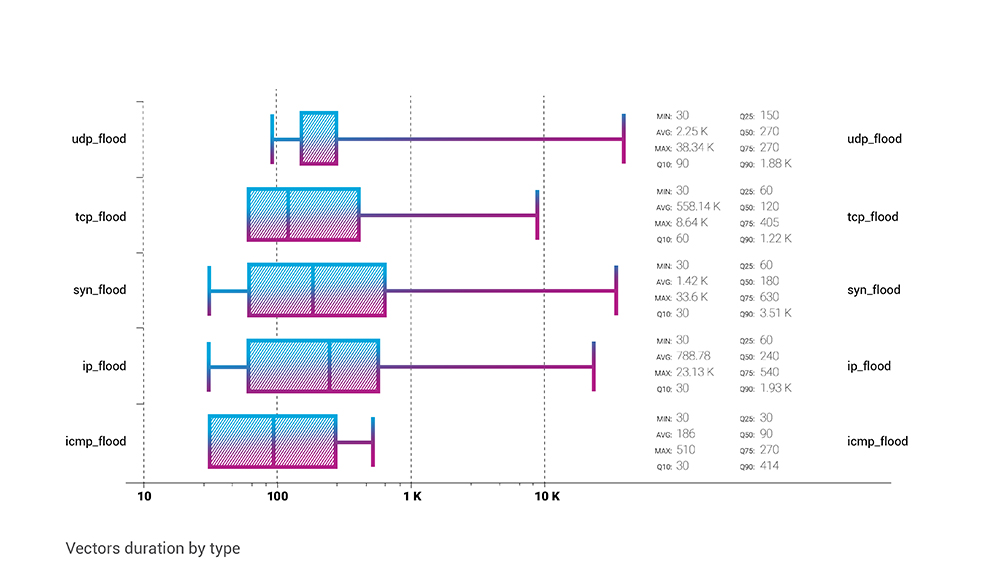
Here we can take a look at individual vector attacks duration. As always, UDP reigns these statistics, with the maximum attack time of more than ten and a half hours. Other than that, the average attack time for each vector is a peculiar metric - and here, we can see that the UDP flood tops the average duration chart with 2250 seconds or 37.5 minutes. However, the SYN flood average duration is not much shorter - 23.6 minutes. TCP flood and IP flood average duration is much lower - <10 minutes and ~13 minutes, respectively.
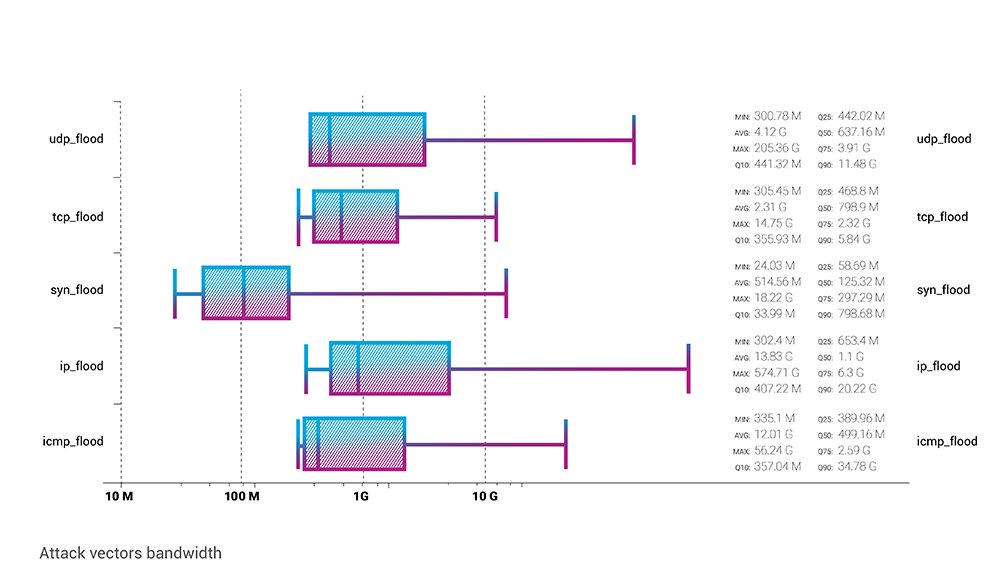
SYN flood has the lowest average bitrate among all the attack vectors - with a Q2 average of 514 Mbps. Vice versa, IP flood represents the highest average attack bitrate - almost 14 Gbps.
Like last quarter, we want to see how the average attack bandwidth, across all vectors, evolves quarterly.
Average bandwidth of all DDoS attacks we mitigated during Q4 2020: 4.47 Gbps;
Average bandwidth of all DDoS attacks we mitigated during Q1, 2021: 9.15 Gbps;
And now, the same metric during Q2, 2021: 6.5 Gbps.
Still quite impressive, taking into account that May and June could be considered vacation months almost all over the world. And with the increasing attack duration, it's even more concerning, although anticipated, trend.
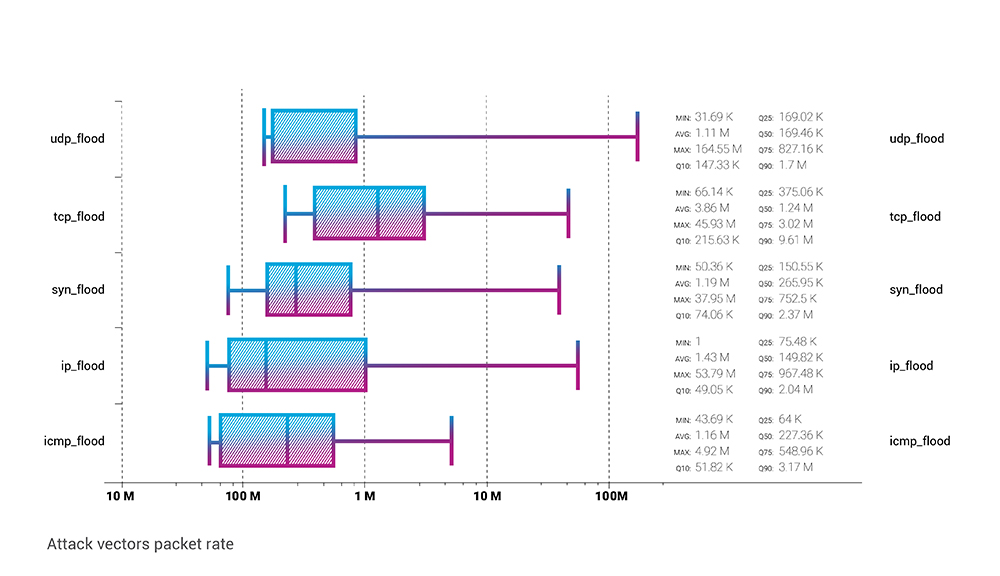
Again, from the packet rate perspective, the UDP flood was the obvious favourite in Q2. Although on the average side TCP flood vector is almost 4x more intensive than any other.
And that maximum of 165.5 MPPS in the UDP flood was achieved with a somewhat usual bandwidth of 200 Gbps.

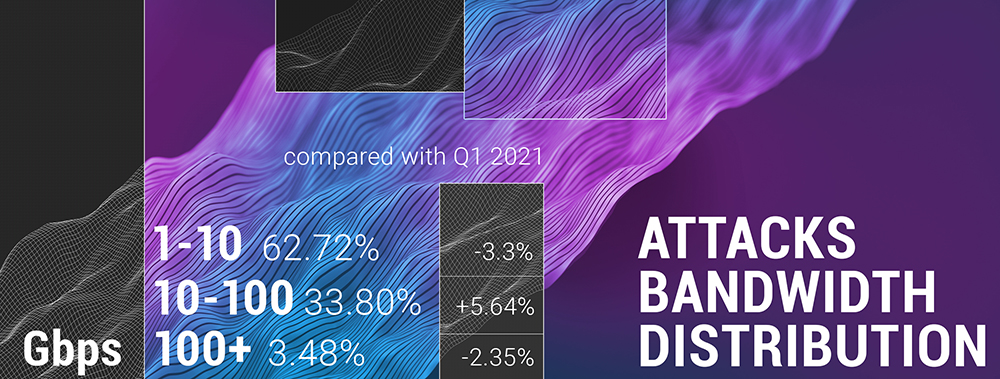
The 10-100 Gbps interval is getting more and more attacks in Q1 and Q2 of 2021, implying the fact that there is a massive increase in average and minimum attack bandwidth. Now more than ⅓ of all the attacks fall into the 10-100 Gbps segment, compared with only 15% in the previous year.
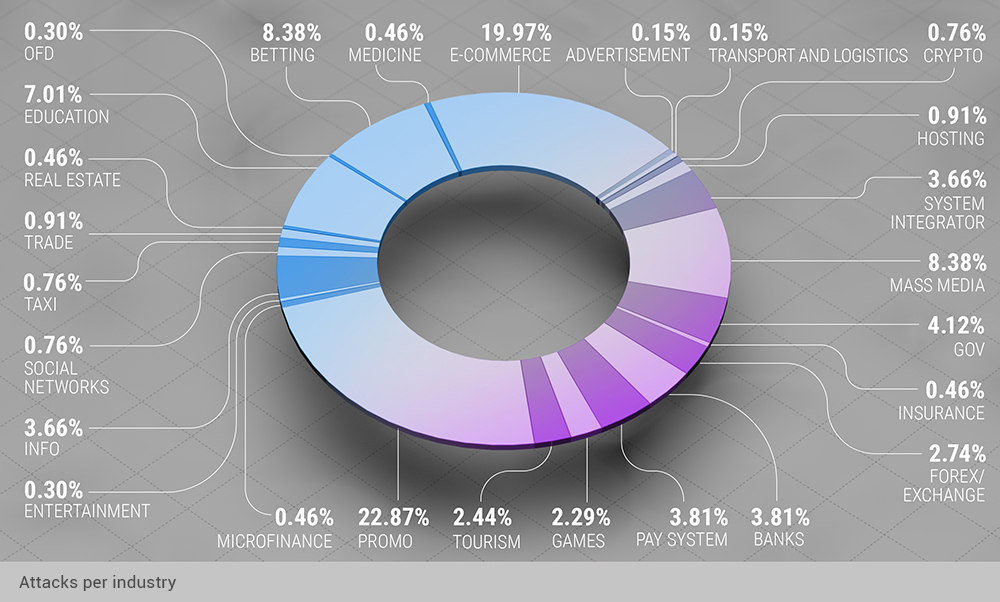
Promo web pages that DDoS attacks targeted could effectively represent almost any industry, which is why we usually look past the "Promo" segment, even though it contains nearly ¼ of all the Q2 DDoS attacks. We tend to think that this is because active marketing measures in promoting such web pages are on (ads), and DDoS attacks were historically effective as non-market competition measures.
Other than that, we see that the e-commerce share of attacks only grows over time, this time by 1% QoQ.

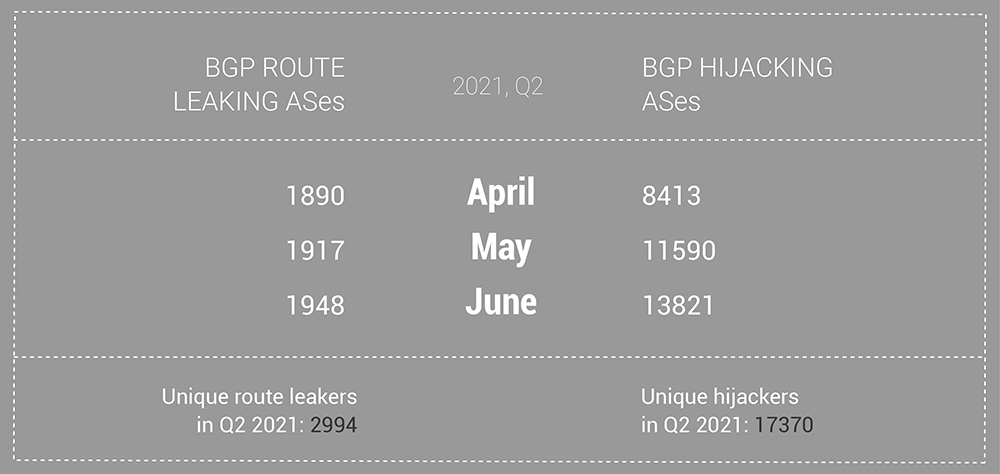
The number of unique leaking and hijacking ASes dropped slightly in Q2 compared to Q1, although the number of individual actors within observed months has not. Furthermore, in May and June, the number of hijacking ASes jumped significantly compared to previous months, May was the first month where the number of unique hijacking ASes exceeded 10k.
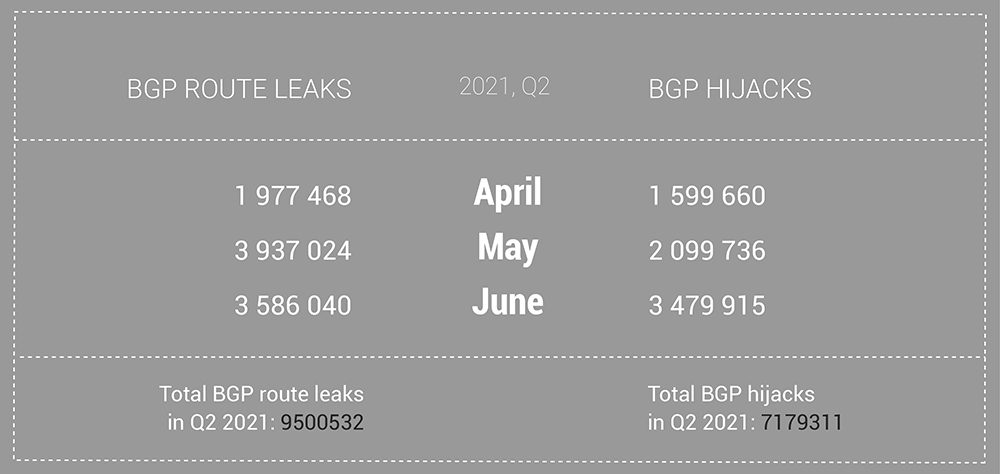
And the number of individual BGP route leaks and hijacks have also risen compared to Q1 data. Almost ten million route leaks in Q2 - that considerable number will stay there for some time since there is still no significant measure to prevent the route leaks from happening. The number of hijacks is comparable to Q1, 2021.
Now, let us take a look at the global incidents that are part of these statistics through each month of the quarter.
Reminder note: Qrator.Radar team has a set of certain thresholds that separate global incidents from the rest. They include affected prefixes, affected autonomous systems, and the incident's distribution among routing tables.
Global BGP Route Leaks:
- April: 0
- May: 1
- June: 3
A detailed description of these incidents could be found according to the occurrence date in Qrator.Radar Twitter feed.
Global BGP Hijacks:
- April: 1
- May: 1
- June: 1
Data sources and observation methodology
Qrator Labs' Quarterly and Annual Reports are based on the data from observed attacks on web pages and servers under the Qrator Labs' DDoS attacks mitigation service and customers insights on the mitigated attacks. The figures and data were collected corresponding to the report's scope timeframe, i.e. either a specific calendar quarter or calendar year.
Each report consists only of the attack data Qrator Labs directly observed ("mitigated"). Qrator Labs does not collect or analyze traffic outside of its network, meaning that all the conclusions we draw are based solely on the data passing through the Qrator BGP anycast network. By 2021 Qrator Labs anycast network exceeds 3 Tbps of filtering capacity built upon 14 points-of-presence, each connected to a Tier-1 ISP.
Qrator.Radar analyzes BGP paths data collected from more than 800 sessions, serving analytics and real-time incident monitoring to the registered and authenticated owners of Autonomous Systems. Qrator.Radar provides a user with historical data on AS connectivity (links), BGP routing anomalies, and network-related security issues.
Qrator.Radar is the BGP monitoring and analytics tool, as well as the vulnerability scanner for known networks.
That means that when scanning a network, Qrator.Radar analyzes the presence of any known amplificators and the amplification (https://en.wikipedia.org/wiki/Denial-of-service_attack#Amplification) factor itself. This data is further processed to give ISP (or, more precisely, ASN) owners the possibility to analyze the availability of any of those services, which attackers could exploit for DDoS attacks.
Such scans are not harmful in any way to the company's hardware or software, Qrator.Radar collects the data only to notify the rightful owners of the network of when and which amplificators became available within the networks they manage. We require authorization from the ASN owners before showing this kind of information we consider sensitive.
Besides the network data and its analysis Qrator Labs also employs open-source intelligence analysis within the public reports. Qrator.Radar, in turn, uses data from publicly available databases to get the IRR, RPKI and geolocation information to correlate between own and open-sourced data.