
The second quarter of the year has ended and, as usual, we take a look back at the mitigated DDoS attacks activity and BGP incidents that occurred between April and June 2022.
After an upheaval of DDoS attacks and other malicious activity during Q1 things are getting “back to normal”, meaning that the Q2 profile is closer to that of the Q4 2021 data, rather than Q1 2022.
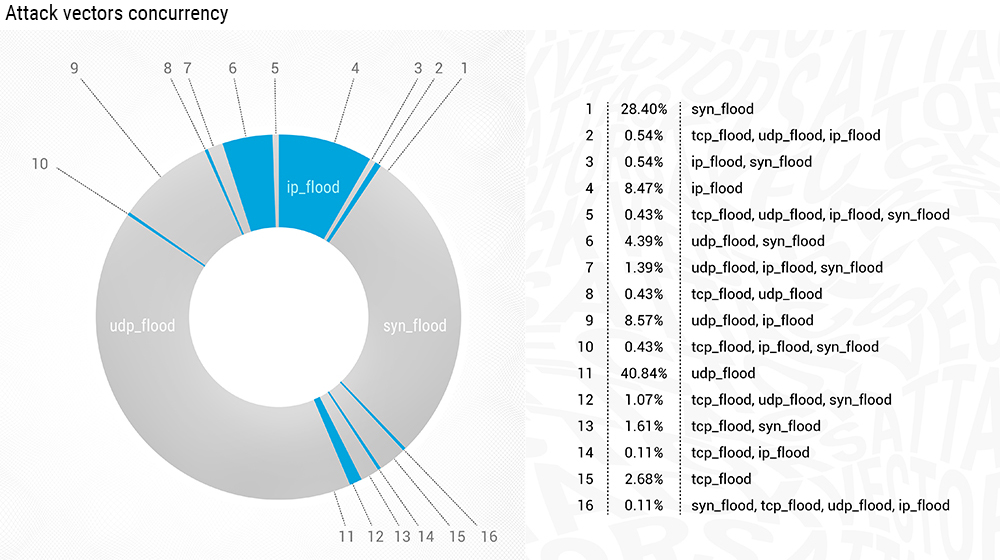
In Q2 2022, the top-3 DDoS attack vectors were:
- UDP flood, responsible for 40.84% of attacks;
- SYN flood, accounting for 28.4% of all the attacks;
- And IP flood, with a much smaller 8.47%.
This snapshot is closely matching the Q4 2021 profile, with a slightly higher proportion of UDP flood in Q2 2022, and a lesser IP flood percentage compared to Q4 2021.
Those three vectors together make 77.81% of all the DDoS attacks data in Q2 - around 3% less than in the previous quarter, when SYN flood was the leader, followed by IP flood and only then UDP flood in terms of distribution of attack vectors.
The most notable concurrent vector combination - mixed UDP flood and IP flood, jumped back to 8.57% from the last quarter's minimum of 4.19%.
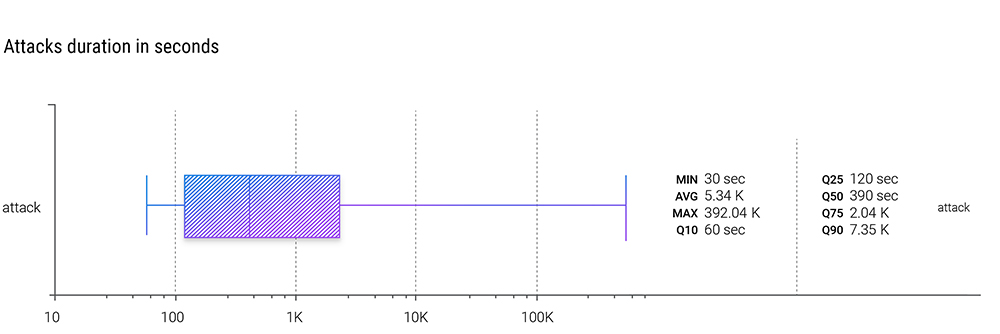
DDoS attacks are continuously growing in duration. Last quarter, the median attack time added more than 50% compared with Q4 2021, and in the Q2 of the current year, it gained additional 60 seconds - a full minute, and now the median attack takes place for 6 and a half minutes.
Although it is important to note that the average attack time shrank from 10 407.45 seconds in Q1 2022 to 5 340 seconds in the second quarter. The lesser percentiles (Q10 and Q25, same as the median - Q50) added values to the duration, while larger percentiles (Q75 and Q90) lost, quarter over quarter.
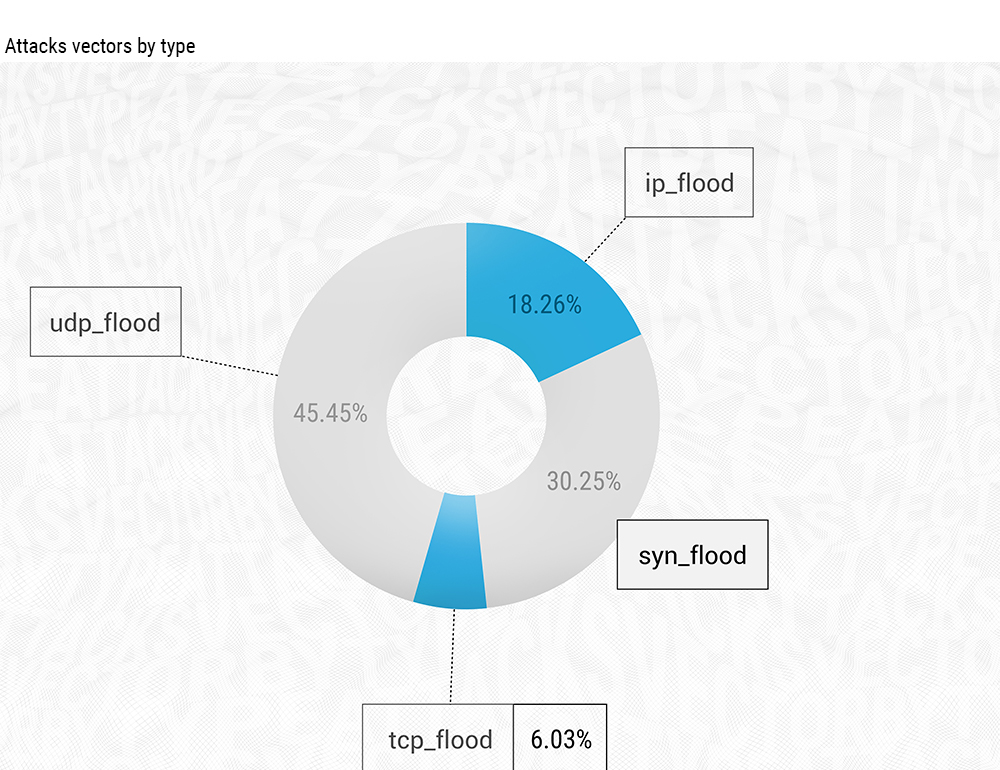
As it was mentioned before, in the clean (without concurrency) attack vectors distribution data, we see a return of the more “normal” picture, as it was in Q4 2021.
UDP flood reigns with almost half - 45.45% of all attacks, SYN flood stands second with the third - 30.25%, and IP (fragments) flood accounts for 18.26%.
Interestingly, Q2 2022 was the first quarter since the start of our quarterly reports at the beginning of 2021, when IP flood held the third place - it is usually either first or second.
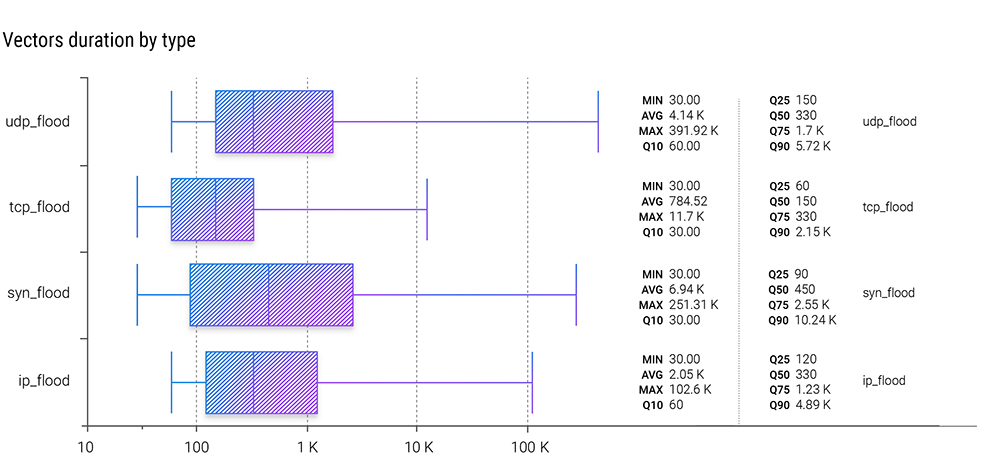
The individual vectors' duration also dropped significantly compared to Q1 2022. Although, it is the TCP flood that shows the lesser digits compared with the three other vectors, instead of Q1’s IP (fragments) flood.
The only vector that gained quarter over quarter in terms of duration is the IP flood, which is now significantly longer in all percentiles than it was a quarter of a year ago.
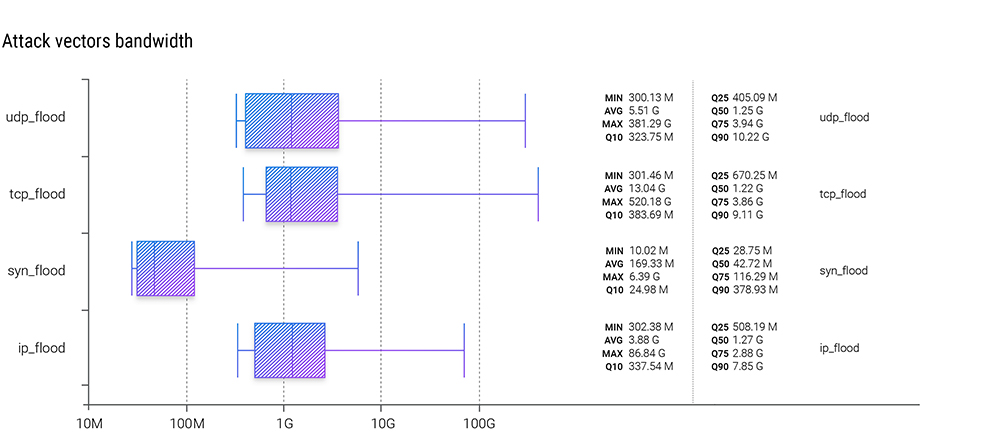
On the bandwidth side of things, there is an almost invisible, but rather important change - in Q2, TCP flood showed numbers larger than UDP flood, for the first time. In Q2 2022, the maximum attack bandwidth reached 520.18 Gbps of TCP flood, and UDP flood stands in second place with the maximum attack bandwidth of 381.29 Gbps.
Comparing the median (Q50) - the UDP flood is still showing a number larger than that of the TCP flood, but the difference is almost negligible - 1.22 Gbps for the TCP flood and 1.25 for the UDP flood. Although, in Q2 2022 the highest median is in the IP flood territory - 1.27 Gbps.
In the quarterly reports, we register the development of average (L3 - L4) attacking bandwidth quarter over quarter. Last quarter - Q1 2022, marked the lowest average bandwidth of attacks we’ve seen in recent years - 4.17 Gbps, less than half of the largest average bandwidth - 9.15 Gbps in Q1 2021. In Q2 2022 the average attack bandwidth jumped back to 5.17 Gbps and is now on par with the Q4 2021 number. These numbers are valid for volumetric attacks only.
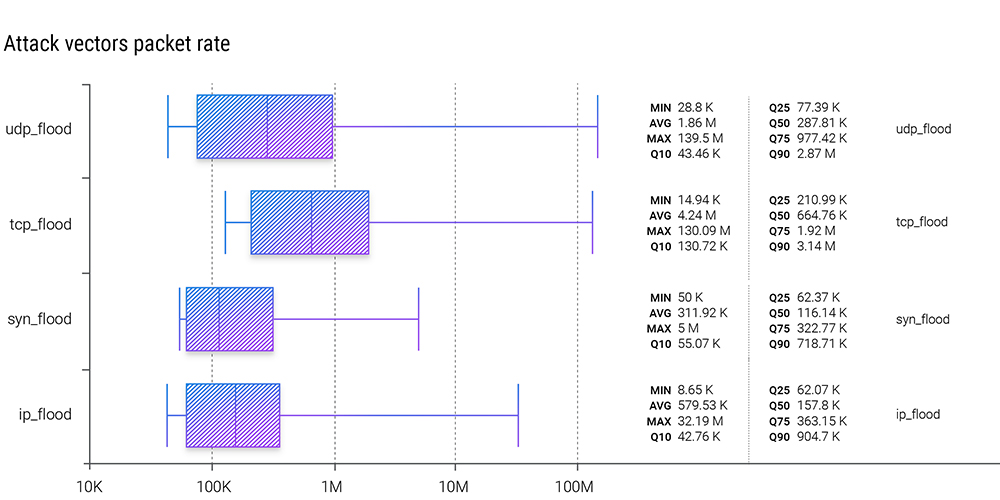
With the packet rate of attacks the trend continues to be unchanged. UDP flood, quarter over quarter, shows the most significant maximum - which in Q2 2022 was 139.5 Mpps, and TCP flood obtains the largest average (4.24 Mpps) and median (664.76 Kpps).
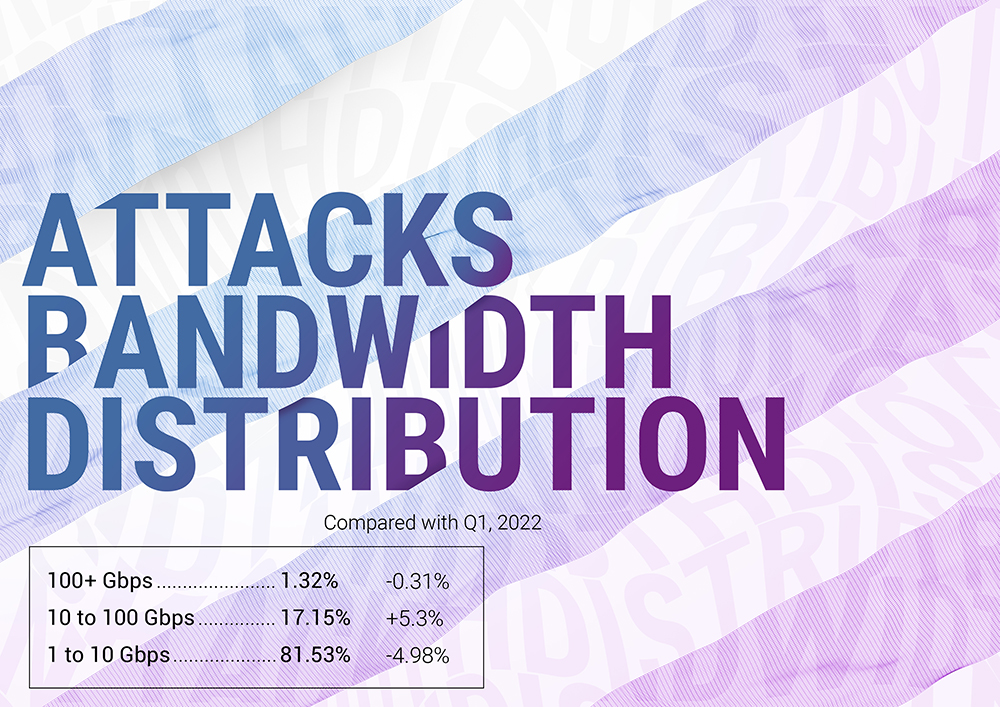
From the attack bandwidth distribution picture we can also state that the chaotic attacks of Q1 slowly came to an end and a significant proportion of DDoS attacks on the Internet shifted back to where they were before - in that “central” range of 10 to 100 Gbps. Although, considering that in Q1 2022, compared with Q4 2021, there was a tremendous increase in smaller attacks QoQ (19%), 5% retake is not that huge.

As we mentioned in the last quarter report, where we unravelled the largest attack source of more than 900 000 devices, that malicious network of devices was not particularly a “botnet”, but more of a “network” of actors that used a Javascript exploit to refer users of one website to produce requests aimed at another website, which was viewed as an attack by the latter.
Now as things settle, the largest attack source numbers are also getting back to reality, and in Q2 2022 we saw the largest attack source consisting of “only” 84 000 devices - half of what it was in Q4 2021 and slightly more compared to Q3 2021.
Q2 2022 is the fourth quarter in a row when we attempt to categorize application layer, or L7, DDoS attacks.
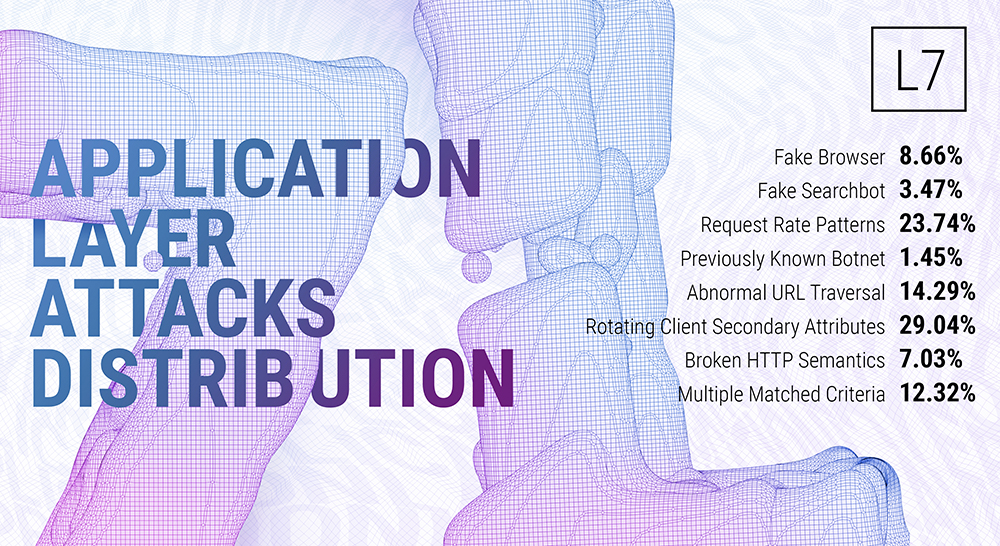
And there are some differences, compared with the previous quarter. Most significant - drop in the “Rotating Client Secondary Attributes” techniques in favour of “Broken HTTP Semantics”.
Now the largest category is Rotating Client Secondary Attributes, which refers to an unusual set of headers in the request, and accounts for more than a quarter - 29.04% of L7 DDoS attacks.
Request Rate Patterns include everything that stands out from what is expected from a legitimate user in terms of request rate and collected 23.74% of Q2 2022 application layer attacks.
That differs from the third category of Abnormal URL traversal, which is precisely what it sounds like - an action that a legitimate user often doesn't even have the ability to make, where we saw 14.29% of attack data.
Broken HTTP Semantics - leader of the previous quarters, now amasses only 7.03% of L7 attacks - a huge drop compared to 2021 and Q1 2022 data.
Combined, those top four categories are held responsible for 74.1% of the L7 attack, with 12.32% in Multiple Matched Criteria, where we put all concurrent L7 attacks.

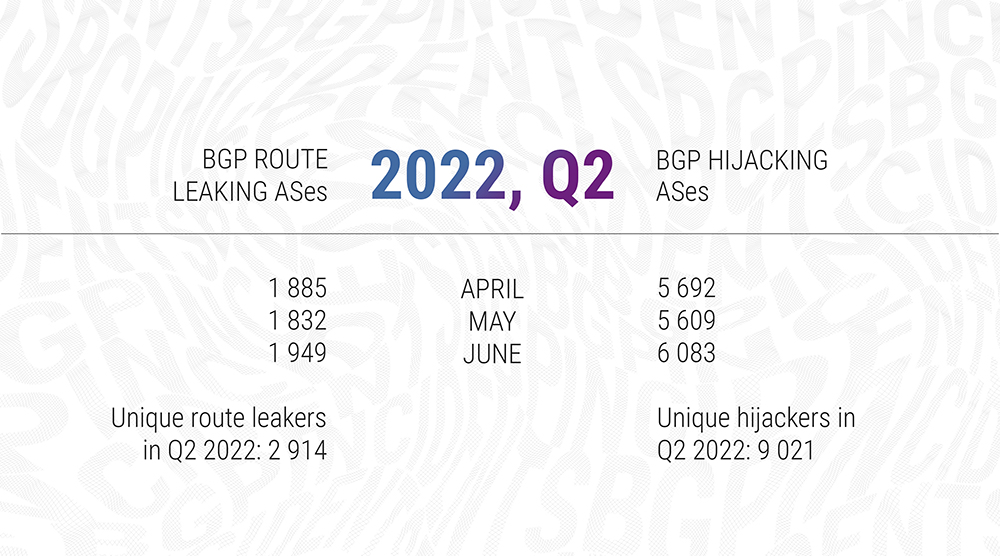
In Q2 2022 we saw interesting shifts in the BGP routing security landscape. First of all - almost 50% drop in the number of unique hijacking ASes during Q2 2022 in comparison to Q1. Which did not help the situation with BGP Hijacks, as we will see further.
The number of unique route leaking ASes dropped only slightly, although the non-unique BGP route leaking AS numbers tend to shrink over time, they don’t go down dramatically. Nevertheless, 2 914 unique route leaking ASes is the smallest number we saw up until now. We tend to think that the reason for that is the improvement in BGP security in some ISPs that previously gave us those huge numbers, sometimes unintentionally, for example due to route flapping.
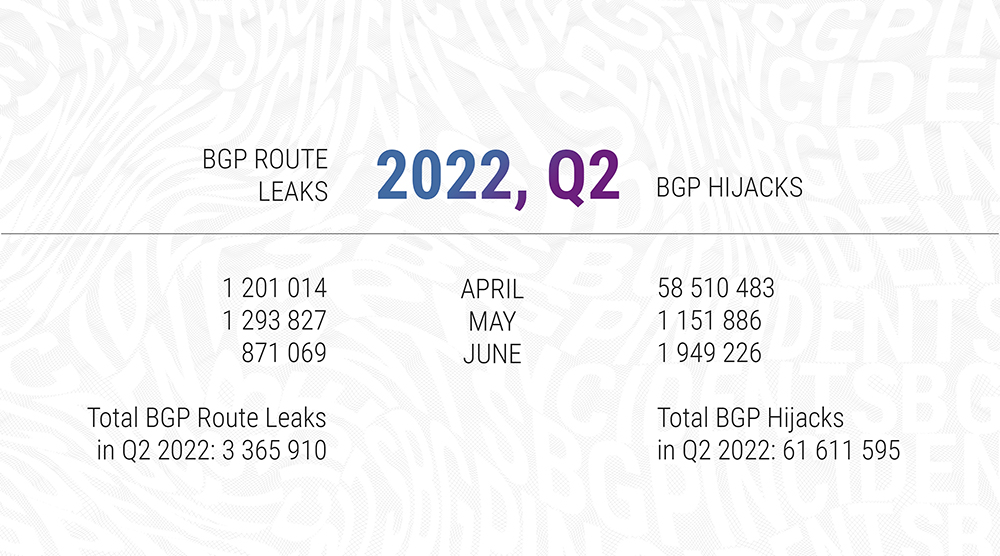
On the individual BGP route leaks and hijacks scene, the changes are more visible. Remember, here, we count the total number and not the unique routing incidents - if one AS originates a route leak, that is distinguished as a separate one by the Qrator.Radar model - we count it in.
First of all, the number of total route leaks dropped four times compared to the Q1 2022 data - from 11 695 186 to 3 365 910. That’s good news.
Bad news - April’s 58 510 483 BGP hijacks are simply a tremendous number, never seen before. And this is due to only 2 autonomous systems: AS27693 which announced 1 IPv6 prefix - 2800::/12; and AS262493 which announced multiple IPv4 /32 network prefixes, which is 54 349 377 IP addresses combined.
So it’s a good thing we have ROA and RPKI-based validation working. And, maybe, we will see an RFC9234 adoption growing in the nearest years that would help tackle route leaks.
Now, let us look at the global incidents that are part of these statistics through each month of the quarter.
Reminder note: Qrator.Radar team has a set of certain thresholds that separate global incidents from the rest. They include affected prefixes, affected autonomous systems, and the incident's distribution among routing tables.
Global BGP Route Leaks in Q2 2022:
- April: 3
- May: 1
- June: 1
One could find a detailed description of these incidents according to the occurrence date in the Qrator.Radar Twitter feed.
Global BGP Hijacks in Q2 2022:
- April: 0
- May: 2
- June: 1
Data sources and observation methodology
Qrator Labs' Quarterly and Annual Reports are based on the data from observed attacks on web pages and servers under the Qrator Labs' DDoS attacks mitigation service and customers insights on the mitigated attacks. The figures and data were collected according to the report's scope timeframe, i.e., a specific calendar quarter or calendar year.
Each report consists only of the attack data Qrator Labs directly observed ("mitigated"). Qrator Labs does not collect or analyze traffic outside of its network, meaning that all the conclusions we draw are based solely on the data passing through the Qrator BGP anycast network. By 2022 Qrator Labs' anycast network exceeds 3 Tbps of filtering capacity built upon 15 points-of-presence, each connected to a Tier-1 ISP.
Qrator.Radar analyzes BGP paths data collected from more than 800 sessions, serving analytics and real-time incident monitoring to the registered and authenticated owners of Autonomous Systems. Qrator.Radar provides a user with historical data on AS connectivity (links), BGP routing anomalies, and network-related security issues.
Qrator.Radar is the BGP monitoring and analytics tool and the vulnerability scanner for known networks.
That means that when scanning a network, Qrator.Radar analyzes the presence of any known amplificators and the amplification (https://en.wikipedia.org/wiki/Denial-of-service_attack#Amplification) factor itself. This data is further processed to give ISP (or, more precisely, ASN) owners the possibility to analyze the availability of any of those services, which attackers could exploit for DDoS attacks.
Such scans are not harmful in any way to the company's hardware or software, Qrator.Radar collects the data only to notify the rightful owners of the network of when and which amplificators became available within the networks they manage. We require authorization from the ASN owners before showing this kind of information we consider sensitive.
Besides the network data and its analysis Qrator Labs also employs open-source intelligence analysis within the public reports. Qrator.Radar, in turn, uses data from publicly available databases to get the IRR, RPKI and geolocation information to correlate between own and open-sourced data.