DDoS Attacks by Vectors
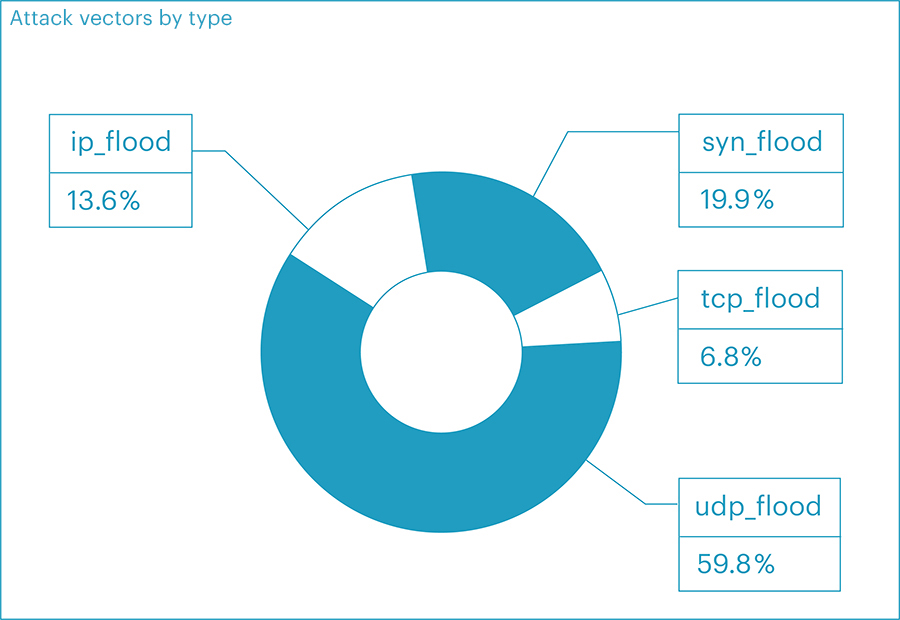
In the second quarter of 2023, we observed some noteworthy changes in the distribution of DDoS attack vectors compared to the previous quarter. The most significant shift was a substantial increase in UDP flood attacks, which nearly doubled from 37.44% to 60.1% when compared to the first quarter. Additionally, SYN flood attacks saw a slight increase from 17.63% to 18.1%, while IP flood attacks surpassed TCP flood, dropping from 19.34% in the first quarter to 4.06% in the second quarter.
The net distribution of attack vectors in the second quarter ranked as follows:
- UDP flood - 59.77%
- SYN flood - 19.88%
- IP flood - 13.57%
- TCP flood - 6.78%
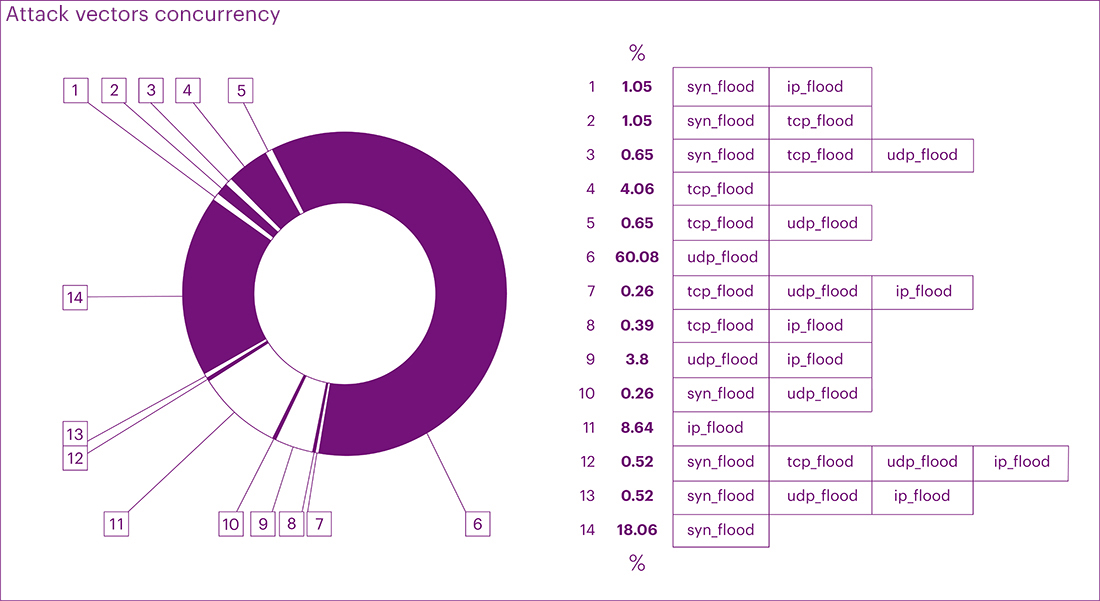
Analyzing mixed vectors, we observed similar trends in attack percentages and durations. The share of TCP floods decreased, SYN floods remained consistently high, and UDP floods and IP floods witnessed an increase in the attack mix.
Of particular interest is the ongoing dynamic increase in the absolute values of UDP flood attacks over the past three years both, in general relative to other vectors, and in particular in the second quarter relative to other quarters. This trend exhibits an average growth from 29.31% to 51.45% (between 2021 and 2023). Notably, as the summer business season in various business segments approaches, the volume of UDP flood attacks increases by over 20%, which is confirmed by a large number of attacks on these segments.
In general, the increase in UDP flood rates can be attributed to significant changes in the infrastructure of most businesses. With the onset of the pandemic in 2020, a vast majority of companies shifted to a remote work format. Before 2020, VPN solutions were primarily used for remote access to corporate resources, relying mainly on TCP (TLS) or IPsec (ESP) as transport protocols. However, after 2020, there was a widespread shift to UDP, with many adopting the DTLS protocol. This transition was driven by the need to enhance application performance and scalability, especially when clients accessed the internet through mobile networks or Wi-Fi, which typically have higher latency and packet loss, affecting the performance of TCP-based solutions.
The development of remote offices also led to the expansion of internet channels and the adoption of additional communication tools like video conferencing, instant messengers, and IP telephony.
Unfortunately, as businesses evolved, so did attackers. They recognized that generating UDP traffic is relatively easy and cost-effective, making attacks at the UDP level simpler to organize and cheaper to execute. Consequently, during times of heightened business activity and seasonal trends, the number of UDP flood attacks can escalate rapidly, and then decline just as swiftly. These attacks often require minimal capital expenditures for an attacker.
This trend also indicates a potential rise in the bitrate of attacks in the future, possibly reaching new records. The widening of data transmission channels and decreasing costs of attacks make it easier for attackers to purchase or organize botnets that are harder to trace.
Furthermore, the rise in attacks on UDP is partly driven by the emergence of new protocol versions, such as HTTP/3 and RDP 8.1, which prefer UDP for data transport. As more and more companies adopt these updated protocols, the prevalence of UDP-based attacks may continue to increase.
Overall, the shift to UDP-based attacks highlights the importance of robust cybersecurity measures, proactive defenses, and ongoing adaptation to counter the evolving tactics of malicious actors. Businesses must remain vigilant in safeguarding their digital assets and sensitive information from the growing threat of DDoS attacks.
The number of SYN flood attacks has remained relatively stable over the past three years. This stability can be attributed to reduced opportunities for attackers, as many hosting providers now filter outgoing traffic based on BCP38 recommendations, hindering the organization of SYN flood attacks. Moreover, using infected home machines for SYN floods is no longer as advantageous for attackers, given more lucrative options like spam mailings, cryptocurrency mining, or L7-level attacks.
Overall, we have observed a seasonal pattern in DDoS attacks, with higher activity in the second and third quarters, likely influenced by the spring and early business season in September.
In terms of attack combinations, the total volume of the four leading vectors (UDP, SYN, IP, and TCP floods) amounted to 90.84% of all neutralized attacks, which is 6.85% more than the previous quarter. Complex (mixed) attacks decreased from 16.01% to 9.16%, with the UDP flood + IP flood combination holding the largest share. Interestingly, the total number of complex attacks has decreased since the beginning of the year, showing fluctuations and indicating a trend towards more single-vector attacks.
The total number of attacks has been steadily increasing in absolute terms. After experiencing a significant drop of more than 30% in the fourth quarter of the previous year, the number of attacks has been gradually recovering. Over the past six months, there has been a notable 40% rise in the total number of attacks.
Looking ahead to the third quarter, it is likely that we will continue to witness a significant volume of attacks, mainly driven by the high prevalence of UDP flood attacks. However, towards the end of the year, barring any significant changes influenced by external factors, we can expect a slight decrease in the number of UDP attacks. This might coincide with a decrease in business activity during the New Year period.
On the other hand, the volume of SYN flood attacks generated on the internet is expected to remain at a similar level, showing consistent trends in the face of changing attack patterns. As we move forward, cybersecurity measures should be continually reinforced to effectively combat the growing threat of attacks and ensure protection of digital assets and sensitive data.
Duration of attacks
The duration of attacks in the second quarter showed a negative trend. The average duration decreased by 29.15%, almost returning to the indicators of the fourth quarter of 2022, amounting to 47 minutes. The same indicator in the first quarter was more than one hour.
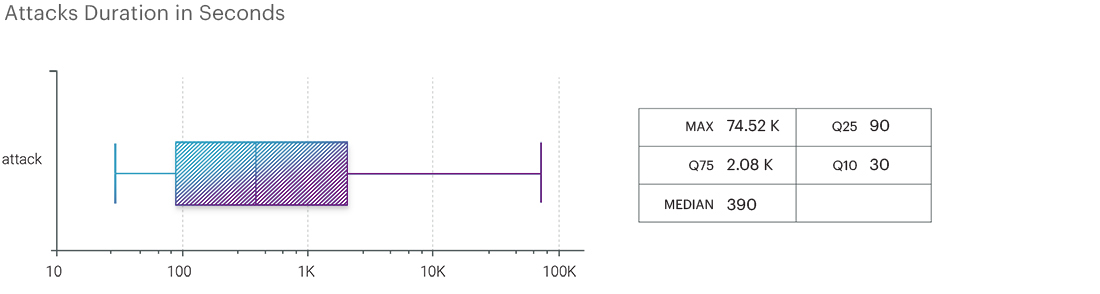
The maximum duration is also decreasing – this time from 42 hours in the first quarter to 20.7 hours in the second one. Unlike the first quarter, where the banking sector was hit the hardest, this time around the online gaming industry was hit.
The reduction in the maximum duration of DDoS attacks can be attributed to the fact that attackers now do not focus on individual resources, attacking them for a long period of time. If an attack is not successful, they immediately switch to other targets, of which the attackers have a huge number, and do not waste their time. The median value continued to grow, returning to the level of the second and third quarters of 2022 and amounting to 390 seconds.
Geographic distribution of attack sources
In the second quarter, Russia accounted for the largest number of blocked IP addresses - 8.2 million. The United States became the second most popular source of attacks with a result of more than 3 million blocked addresses. China rounds out the top three accounting for 1.4 million addresses.
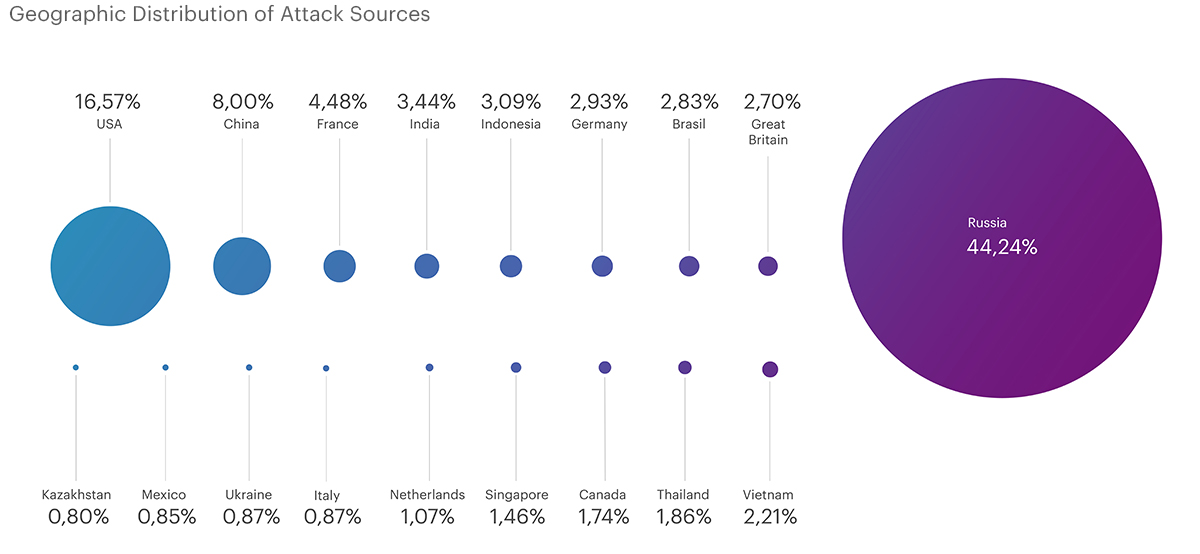
In total, according to the results of the second quarter, almost 19.5 million IP addresses from which attacks were made were blacklisted. The top countries also included France (830 thousand), India (638 thousand), Indonesia (573 thousand), Germany (543 thousand), Brazil (524 thousand) and the UK (500 thousand).
Research results obtained in the second quarter showed that geo-IP blocking has become less effective. The reason for this was the behavior of attackers who, in order to bypass the blocking, began to use local traffic sources in the countries where their victims are located.
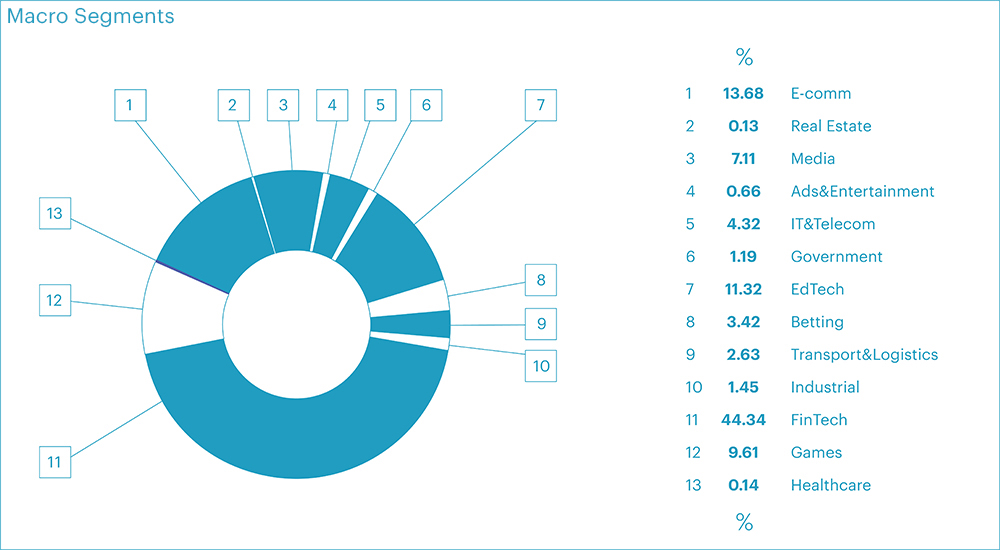
Distribution of Attacks by Industry in Q2 2023
From a business perspective, the financial segment bore the brunt of cyberattacks in the second quarter, accounting for a significant 44.34% of all L3-L4 attacks. Following closely were the segments of e-commerce and online education, making up 13.68% and 11.32% of attacks, respectively.
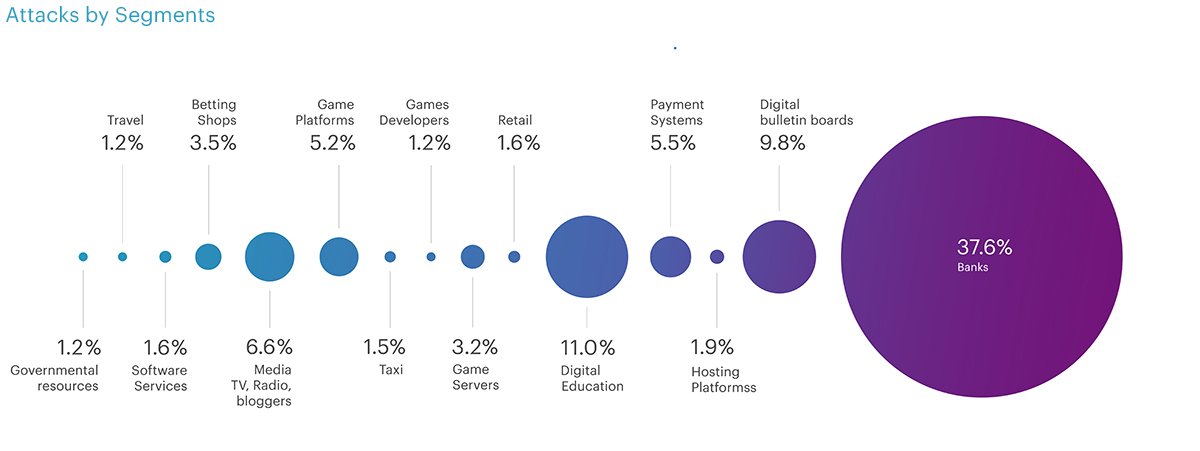
Taking a closer look at these segments reveals noteworthy details:
- Banks: Banks experienced the highest number of attacks in the second quarter, witnessing an increase of almost 30%. The main peak of attacks occurred in April, with a slight decline in May, followed by a significant surge in June. In total, banks accounted for 37.6% of all recorded attacks in the quarter. The rise in attacks can be attributed to the active business season in summer, during which banks actively attract deposits and issue loans for travel, construction, and repairs.
- Educational Services: The educational sector ranked second, with 11% of all attacks. The heightened attention from attackers can be linked to the end of a school year, commencement of final exams, and the admission process for universities. Moreover, the demand for online educational programs tends to increase during school holidays, intensifying competition in this area and stimulating the demand for DDoS attacks.
- Electronic Bulletin Boards and Online Gaming: The third place was almost equally divided between the segments of electronic bulletin boards (9.8% of attacks) and online gaming (9.6% of attacks).
When considering attack duration, a different pattern emerges. The longest attacks were arranged on gaming platforms (20.7 hours), online media (17.3 hours), and travel services (12 hours). However, if we analyze the 90th and 75th percentiles, the top three longest attacks included travel services, banks, and telecom operators, respectively.
When considering the duration of attacks, the landscape appears quite distinct. Surprisingly, the longest attack in the banking sector lasted only 4.9 hours, ranking fifth in duration. The top three positions were claimed by gaming platforms (20.7 hours), online media (17.3 hours), and travel services (12 hours). However, if we focus on the 90th and 75th percentiles, the top three look a little bit different, with travel services, banks, and telecom operators taking the lead.
In the first quarter, the primary targets of attackers were electronic bulletin boards, online education platforms, and payment systems. Remarkably, the longest attack was directed at the banking sector, lasting 42 hours, despite banks having an average attack duration of only 18.5 minutes. In contrast, online financial platforms experienced an average attack duration of 2.18 hours.
In the second quarter, the picture shifted due to the various activities in different business segments. For instance, in May, payment systems secured a spot in the top three, pushing electronic bulletin boards to the fourth place (10.76% and 8.52%, respectively). The longest attacks, including absolute value, 90th, and 75th percentiles, targeted travel services. This can be attributed to the beginning of the holiday season and the surging demand for travel packages, air tickets, and bookings. Additionally, gaming platforms entered the top three in June, capturing second place with a share of 14.13%. The frequent rotation of segments validates the trend: the number of attacks is rising, but their duration is decreasing. Attackers swiftly shift between segments, seeking new victims in an ever-changing landscape. This dynamic underscores the importance of continuous vigilance and robust cybersecurity measures across all business sectors.
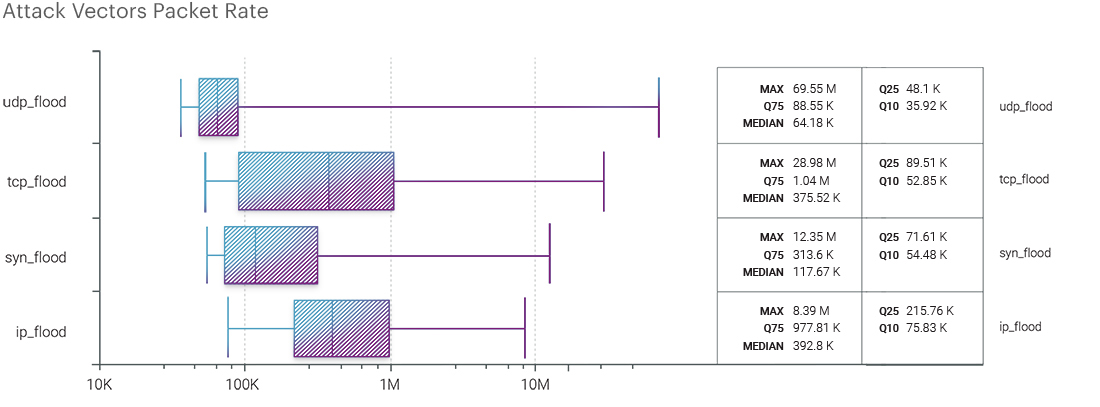
Attack Vectors: Bandwidth
Analyzing the attack bandwidth in the past period, we observed some notable trends. The highest bitrate attack, in the form of TCP flood, targeted the online media segment, reaching an overwhelming 333.78 Gbps. Following closely, the betting segment experienced a significant UDP flood attack, peaking at 293.64 Gbps. Other sectors in the top five with impressive attack rates were educational services (88.78 Gbps), hosting providers (62.93 Gbps), and online gaming (60.42 Gbps). Interestingly, the maximum intensity of attacks was concentrated in online casinos, online media, and online gaming sectors. Betting infrastructures faced intense UDP flood attacks, reaching an intensity of 69.55 Mpps, while internet media dealt with TCP flood attacks at an intensity of 28.98 Mpps.
Comparing the bitrate indicators with the previous two quarters, we observed some slight changes. Both TCP flood and UDP flood attacks had higher maximum values this quarter. However, the median value of attack vectors decreased compared to the previous quarter. Despite these changes, the overall arrangement of values remained consistent. The bitrate of SYN flood and UDP flood attacks remained lower than TCP flood and IP flood attacks, with values of 44.2 Mbps, 421.78 Mbps, 1.4 Gbps, and 3.77 Gbps, respectively.
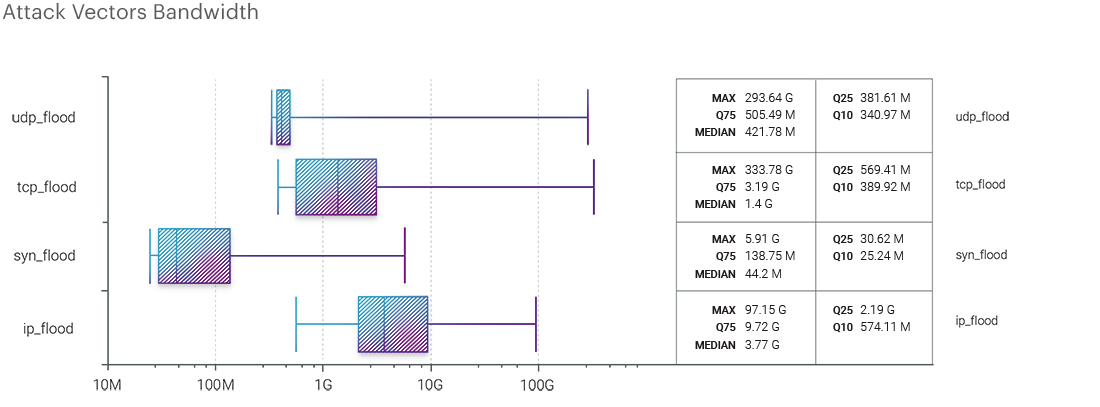
Regarding the packet intensity of various attack vectors, we also noticed minor shifts. UDP flood still held the maximum indicator, although it decreased by half compared to the first quarter of this year, from 127.67 Mpps to 69.55 Mpps. The median value for different vectors stood at IP flood - 392.8 Kpps, TCP flood - 375.52 Kpps, SYN flood - 117.67 Kpps, and UDP flood - 64.18 Kpps. These statistics indicate that attackers continue to employ diverse strategies, and businesses must remain vigilant in enhancing their defenses against various types of DDoS attacks.
The Biggest Botnet
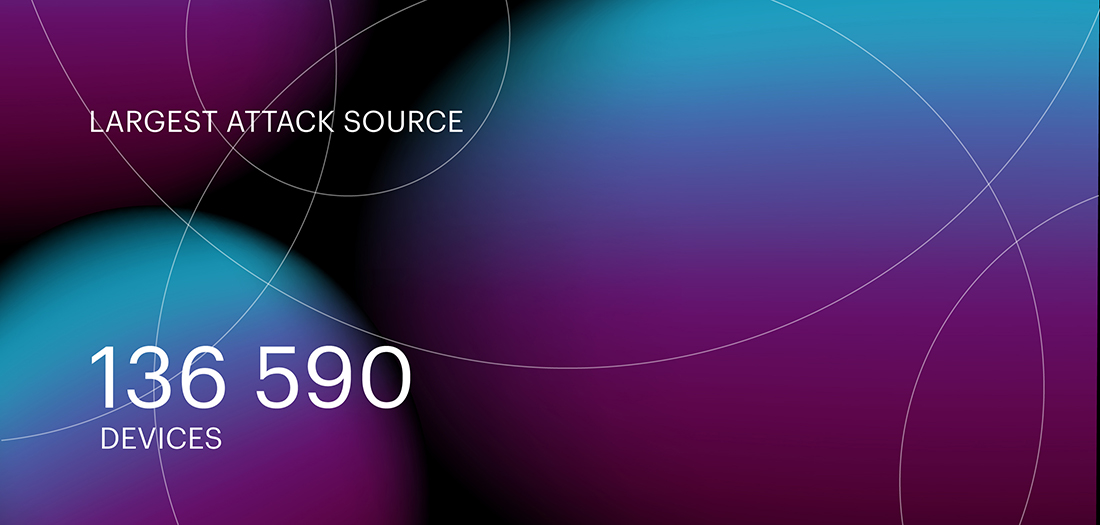
In the second quarter of 2023, the primary source of attacks remained consistent with the previous period. The most notable attack source involved 136,590 devices, which closely resembled the number recorded in the first quarter of 2023. However, it is noteworthy that this figure represents almost a twofold increase compared to the largest attack source observed in the second quarter of 2022, which involved 84,000 devices. This indicates a concerning trend of attackers harnessing larger botnets to carry out their malicious activities.
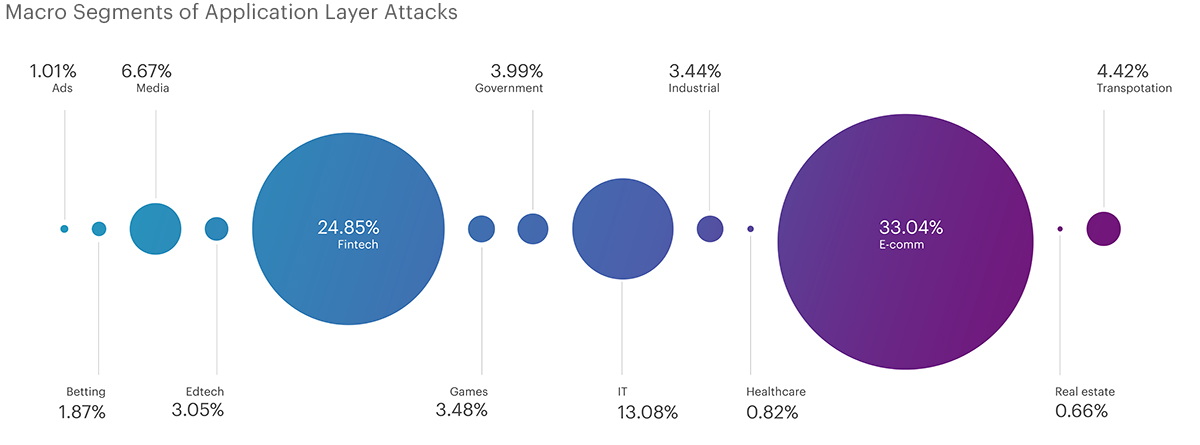
Application Layer Attack Distribution
In the second quarter of 2023, the pattern of application layer (L7) attacks remained relatively consistent with the first quarter, despite a slight decrease in the total number of attacks by 11%. Nevertheless, the number of attacks remained high, with over 16,000 attacks recorded.
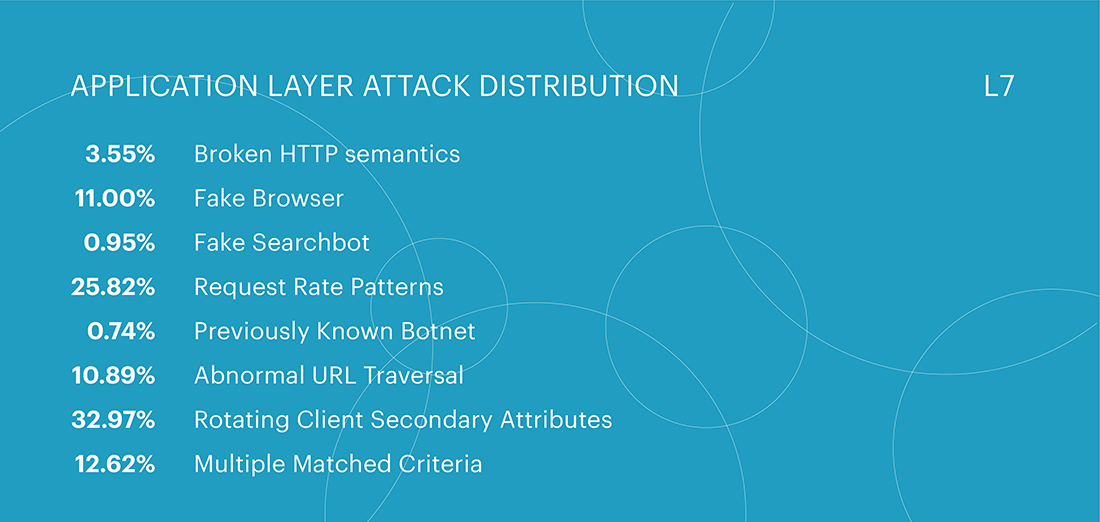
Similar to the beginning of the year, the first two places were dominated by two classes of attacks - Rotating Client Secondary Attributes and Request Rate Patterns. Notably, attacks with an unusual set of headers in the request accounted for 32.97% of all attacks, showing an increase of more than 3% compared to the first quarter. Within the Rotating Client Secondary Attributes class, nearly half of all attacks targeted the e-commerce segment, comprising 49.87% of the attacks. The fintech and IT/Telecom segments followed in second and third place, with 13.55% and 10.21% of attacks, respectively.
On the other hand, the category of indicators that deviate from the expected behavior of legitimate users in terms of the frequency of requests saw a slight decrease, amounting to 25.82%. This category experienced a change in its ranking, with the Abnormal URL traversal class, which previously held the third position, maintaining its first-quarter figures of 10.13%. However, it dropped to fifth place, giving way to two other categories. The third position in the second quarter was now occupied by multi-category attacks that combine two or more methods, amounting to 12.62%. The Fake Browser category ranked fourth with 11% of attacks.
Peak attack rates declined in the second quarter compared to the first quarter. The attack with the highest number of requests per second in the second quarter occurred in the healthcare segment, reaching 154,431 requests per second (rps) and lasting for 24 minutes. In contrast, the first-quarter peak attack rate of 189,350 rps was observed in the segment of hosting providers, lasting 2 hours and 50 minutes.
At the application level (L7), the largest number of attacks in the second quarter targeted the e-commerce segment, amounting to 33.04%. This aligns with the segment's ranking at the L3-L4 OSI level. However, the fintech segment at the L7 level attracted less interest from attackers, with 24.85% of all attacks. The information technologies and telecommunications segment rounded out the top three with 13.08% of attacks. Notably, the e-education segment, which occupied the third place at the infrastructure level (L3-L4), did not enter the top five at the application level (L7).
Analyzing the trends, it is evident that attacks at the application layer (L7) continue to grow. The primary drivers for this increase are the ease of renting large botnets and emergence of new attack vectors.
The simplicity of renting large botnets often renders simple defense mechanisms, such as rate limiting, ineffective against these sophisticated attacks. As a result, significant research efforts are required to develop new protection tools, including zero-day vectors, to combat these evolving threats. Addressing this challenge can be likened to the analogy of enhancing armor and projectile to keep pace with advanced weaponry.
Furthermore, the emergence of new attack vectors is fueled by the release of new versions of the HTTP protocol, such as HTTP/2 and HTTP/3. As companies adopt these new protocol versions, their infrastructure may not be adequately prepared to defend against novel attack types, especially for older hardware systems that do not adapt well to these changes. The acceleration in the adoption of new protocols highlights the need for continuous improvements in cybersecurity strategies to keep up with the evolving threat landscape. Companies must remain proactive and innovative in their approach to stay ahead of malicious actors, as merely catching up might not be enough to ensure comprehensive protection.
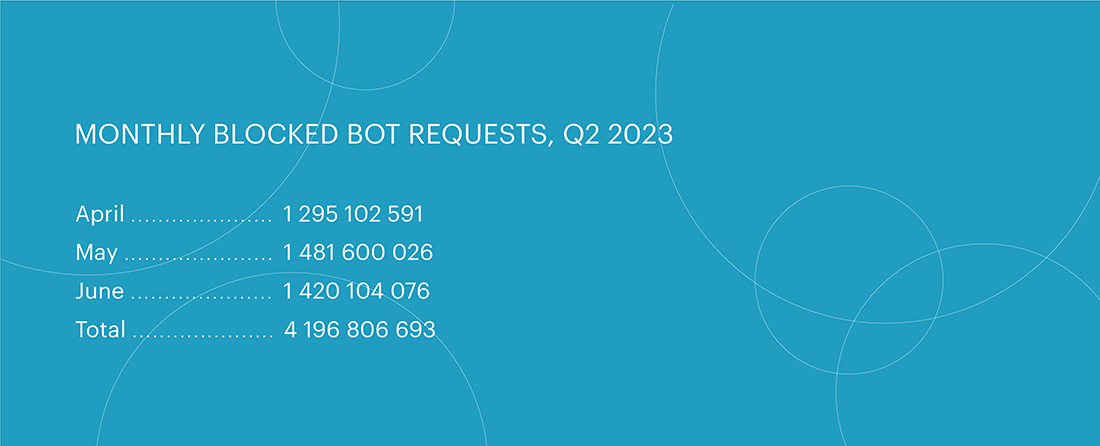
Bot Protection Statistics
In the second quarter of 2023, bot attacks continued to surge, reaching a staggering 4,196,806,693 attacks, which is over 1 billion more than in the previous quarter. May saw the highest number of bot attacks, with 1.48 billion blocked bot requests.
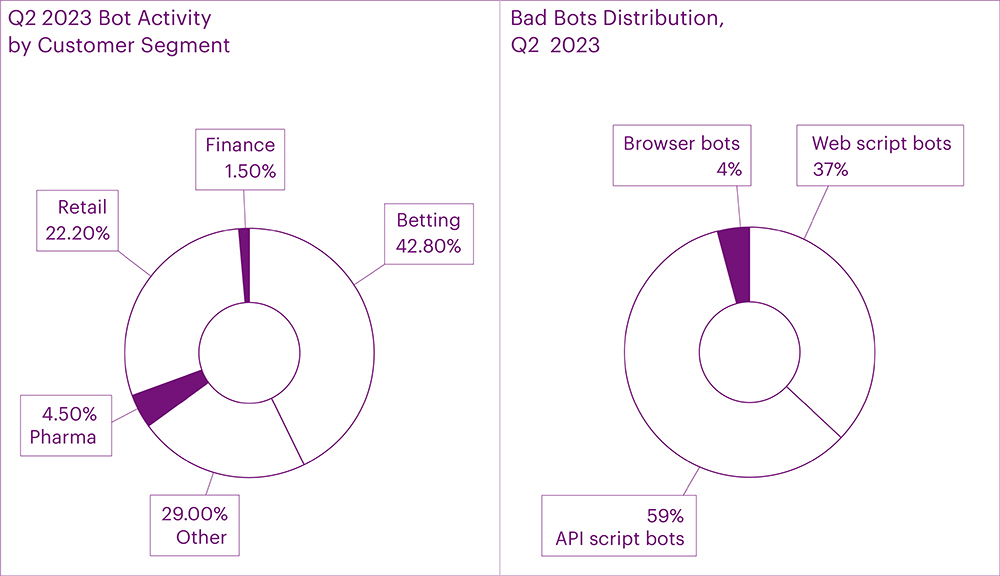
Similar to the first quarter, the sectors most impacted by bot activity were betting (42.8%) and online retail (22.2%). Together, they accounted for a significant 65% of all attacks. This time, the third and fourth positions were occupied by pharmaceuticals and financial institutions, surpassing real estate and online education in terms of bot attack volume.
Clearly, attackers in the second quarter focused their efforts on online betting and e-commerce platforms that launched seasonal promotions. Bots were deployed in these segments to create accounts and exploit promotions designed for beginners (such as welcome bonuses in the form of bonus points, free games, and even money upon registration). Additionally, the bots were involved in various fraudulent activities, including stealing funds from gift cards, scraping prices and content, and even causing disruption by holding goods in shopping carts, thereby preventing legitimate users from accessing them.
The most significant bot attack occurred on May 21st in the betting segment, where a staggering 33,170,356 bot requests were recorded. Meanwhile, the fastest attack took place on June 6th in the e-commerce segment, with peak indicators reaching 12,510 bot requests per second (rps).
The distribution methods most exploited by bots were Web scripts (37%), API scripts (59%), and Browsers (4%). Notably, API scripts dominated the landscape due to their efficiency. API bots usually retrieve smaller responses because they do not request the entire content of web pages, resulting in quicker data extraction. Consequently, API scripts can generate a higher number of requests per second, while being more cost-effective in terms of server resources. It is worth mentioning that API bots sometimes persistently continue their activities for weeks, even after being detected and blocked by security tools.
Looking ahead, it is evident that the popularity of malicious bots will continue to soar with the Internet's development. These bots offer attackers a straightforward yet remarkably effective means of perpetrating fraud at a relatively small budget. This trend has intensified after the pandemic, with an alarming average volume of bots on websites, reaching as high as 40% in 2022. The lucrative nature of this semi-legal business, coupled with its elusive nature, makes it challenging to trace and hold the perpetrators accountable. As such, the battle against malicious bots will require continuous efforts to enhance security measures and stay one step ahead of the evolving threat landscape.
BGP Incidents
The statistics reveal an interesting trend in the second quarter of 2023, indicating a decline in unique autonomous systems intercepting traffic compared to the first quarter. While the number of unique autonomous systems leaking routes remained stable, the number of those intercepting traffic decreased significantly, nearly halving from 13,076 to 7,595. This pattern mirrors the trend observed during the same period in 2022 when the number of unique autonomous systems leaking routes also reduced by half, from 18,352 in Q1 to 9,022 in Q2.
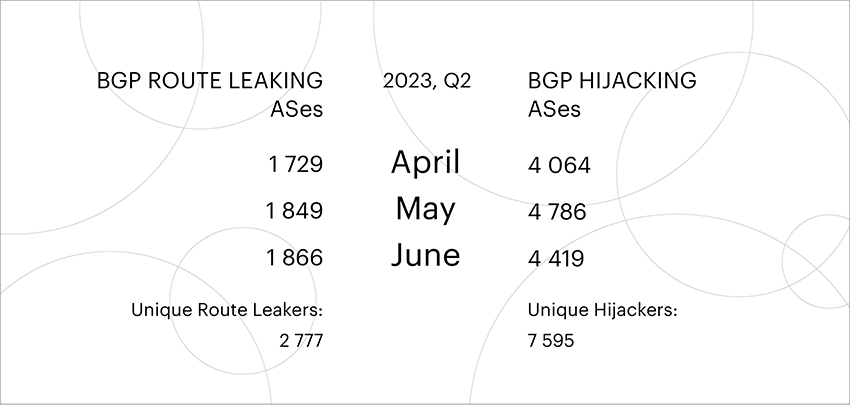
Moreover, the decline in unique autonomous systems conducting traffic intercepts continued year-on-year, dropping from 9,022 in Q2 2022 to 7,595 in Q2 2023. The primary reason behind this decline is the growing adoption of validation based on Route Origin Authorization (ROA) and Resource Public Key Infrastructure (RPKI) - effective measures in combating BGP route hijacking.
It is crucial to understand that these statistics represent the absolute number of routing incidents. If the same autonomous system leaked routes multiple times, each instance is counted as a separate incident.
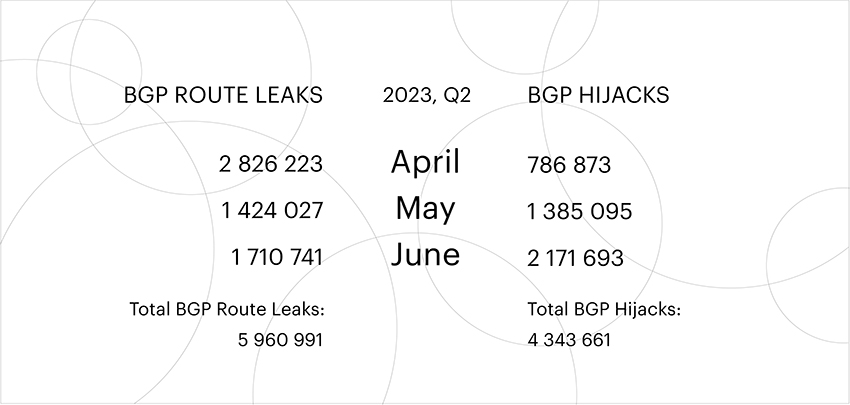
During Q2 2023, Qrator.Radar reported a total of 5,960,991 distinct BGP route leaks, which was 1.5 times lower than in the previous quarter. In contrast, the number of traffic interceptions increased significantly, reaching 4,343,661 incidents - a staggering 40% rise compared to the first quarter of the same year.
Now, let's delve into the global incidents that contributed to these statistics on a monthly basis during the quarter.
Global BGP Route Leaks in Q2 2023:
- April: 0 incidents
- May: 0 incidents
- June: 1 incident
To provide more insights into these specific incidents, detailed descriptions can be found on the Qrator.Radar Twitter feed, providing dates of their occurrence and additional context.
Global Traffic Interceptions Using BGP in Q2 2023:
- April: 0 incidents
- May: 0 incidents
- June: 1 incident
As observed, there was only one global traffic interception incident reported in June, further highlighting the significance of continuous monitoring and vigilant response to ensure the security and stability of the BGP routing infrastructure.
Conclusions
- The UDP flood attacks experienced a significant surge, rising from 37.44% to 60.1% compared to the first quarter. This increase has been consistent for the past three years during the second quarter, coinciding with the summer business season in several sectors.
- The rise in UDP flood attacks can be attributed to the growing remote office infrastructure in businesses. Utilizing the UDP protocol proves to be the most cost-effective and efficient way to transfer data, making it a preferred choice for remote work setups.
- The expansion of communication channels, including telephony and video conferencing, in remote office systems is leading to an emerging trend - an increase in attack bitrates. Wider channels enable attackers to send more traffic, intensifying the impact of their assaults.
- The total number of attacks escalated by 40% in the second quarter. While the number of attacks is increasing, their durations are decreasing. Attackers are now quicker to switch between targets, aiming for quick results or shifting focus if attacks don't yield immediate outcomes.
- Financial sector was the primary target for attackers in the second quarter, accounting for 43.1% of all attacks. This rise is attributed to the seasonal activity of the banking sector during the summer business season.
- In May, travel services experienced the most prolonged attacks due to increased tourist activity. The demand for travel packages, air tickets, and bookings during the holiday season makes this segment an attractive target for attackers.
- Online media faced the most powerful attack with a maximum bandwidth of 333.78 Gb/s in the form of a TCP flood. This indicates the severity of attacks on media platforms during the second quarter.
- Unusual request headers remain the dominant method of attack at the application level, accounting for 32.97% of all attacks. The e-commerce segment is particularly vulnerable, suffering from almost half of these attacks (49.87%) at the L7 level.
- Multi-vector attacks, exploiting two or more vectors, made up the top three attacks at the application level (L7) with an indicator of 12.62%. These attacks pose significant challenges to businesses due to their complexity and ability to circumvent defenses.
- The overall number of L7 attacks remains high due to the ease of leasing large botnets and the emergence of new attack vectors. The release of new versions of data transfer protocols only makes it easier for attackers to launch assaults.
- Attackers have developed techniques to bypass geo-IP attack blocking by using traffic sources in the victim's country. This tactic makes it harder to identify and mitigate attacks based on geographical origin.
- Bot activity has seen a staggering increase, with over 13 million bot requests per day on average. The betting and e-commerce segments faced the brunt of bot attacks in the second quarter, with a total of 1 billion more bot requests compared to the first quarter.
The continual evolution and diversification of attack methods pose ongoing challenges for cybersecurity professionals and businesses in safeguarding their online assets. Staying vigilant and proactive in implementing robust security measures remains crucial to mitigate the impact of such attacks.
Data sources and observation methodology
Qrator Labs' Quarterly and Annual Reports are based on the data from observed attacks on web pages and servers under the Qrator Labs' DDoS attacks mitigation service and customers' insights on the mitigated attacks. The figures and data were collected according to the report's timeframe scope, i.e., a specific calendar quarter or calendar year.
Each report consists only of the attack data Qrator Labs directly observed ("mitigated"). Qrator Labs does not collect or analyze traffic outside of its network, meaning that all the conclusions we draw are based solely on the data passing through the Qrator BGP anycast network. By 2023 Qrator Labs' anycast network exceeded 3 Tbps of filtering capacity built upon 15 points-of-presence, each connected to a Tier-1 ISP.
Qrator.Radar analyzes BGP paths data collected from more than 800 sessions, providing analytics and real-time incident monitoring to the registered and authenticated owners of Autonomous Systems. Qrator.Radar provides a user with historical data on AS connectivity (links), BGP routing anomalies, and network-related security issues.
Qrator.Radar is the BGP monitoring and analytics tool and the vulnerability scanner for known networks.
That means that when scanning a network, Qrator.Radar analyzes the presence of any known amplificators and the amplification (https://en.wikipedia.org/wiki/Denial-of-service_attack#Amplification) factor itself. This data is further processed to give ISP (or, more precisely, ASN) owners the possibility to analyze the availability of any of those services which attackers could exploit for DDoS attacks.
Such scans are not harmful in any way to the company's hardware or software, Qrator.Radar collects the data only to notify the rightful owners of the network of when and which amplificators became available within the networks they manage. We require authorization from the ASN owners before showing this kind of information we consider sensitive.
Besides the network data and its analysis, Qrator Labs also employs open-source intelligence analysis within the public reports. Qrator.Radar, in turn, uses data from publicly available databases to get the IRR, RPKI and geolocation information to correlate between its own and open-sourced data.
Remarks
Rotating Client Secondary Attributes is an unusual set of headers in a request. Request Rate Patterns - indicators that differ from the expected behavior of a legitimate user in terms of request rate.
Web script bots: scripted routines that make direct requests to download web pages and parse the content of the page for certain data without the need for a browser or an external application.
API Script Bots: Scripted routines that make direct API calls to the backend of a web or mobile app to download the required data, ignoring the external interface.
Browser Bots: High-level automation platforms that work with standalone or modified web browsers and have most of the human user experience.