The third quarter of 2021 brought a massive upheaval in the scale and intensity of DDoS attacks worldwide.
It all led to September when together with Yandex, we uncovered one of the most devastating botnets since the Mirai and named it Meris, as it was held accountable for a series of attacks with a very high RPS rate. And as those attacks were aimed all over the world, our quarterly statistics also changed.
This quarter, we've also prepared for your consideration a slice of statistics on the application layer (L7) DDoS attacks. Without further ado, let us elaborate on the details of DDoS attacks statistics and BGP incidents for Q3, 2021.
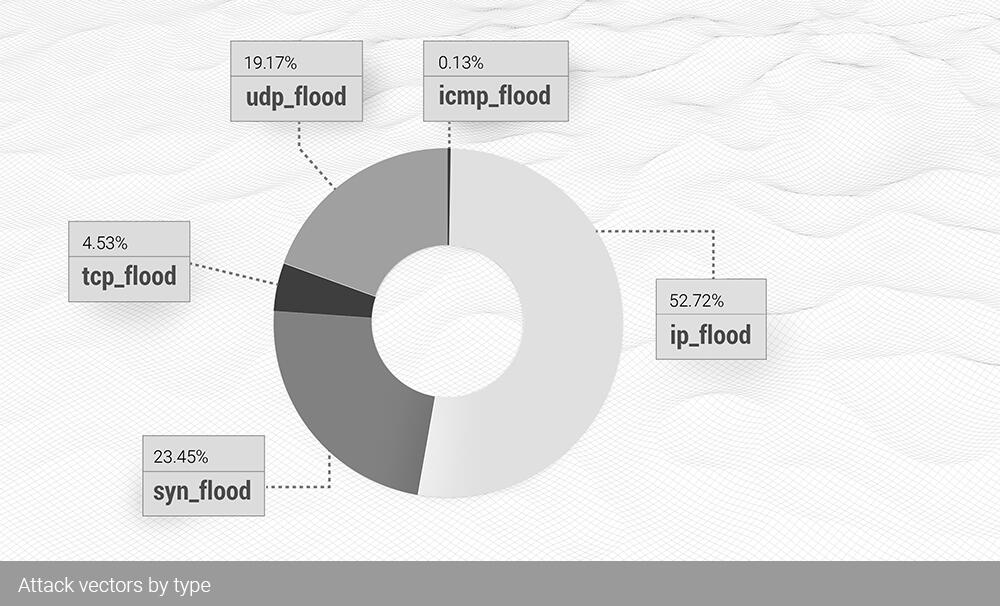
The top-3 attack vectors of the Q3 were:
-
IP flood with 54.49% of all attacks;
-
SYN flood amassing 18.11%;
-
And UDP flood with 12.21%
We see here a turnaround in the statistics since the IP flood changed places with the UDP flood, the vector responsible for most attacks for Q2 2021 - 53.10%. In the last quarter, almost the same number, 54.49%, belonged to the IP flood. We will elaborate on that further.
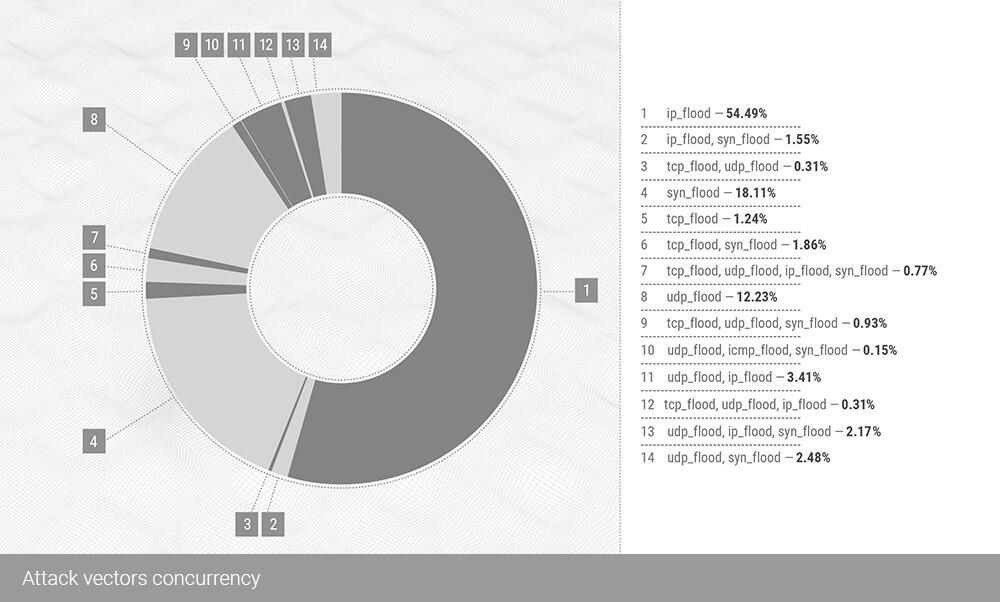
In Q3, those three separate vectors made 84.83% of all the statistics for the given quarter.
The most significant concurrent combination - the UDP flood mixed with the IP flood, made only 3.41% of the total, falling from 6.6% in Q2, 2021.
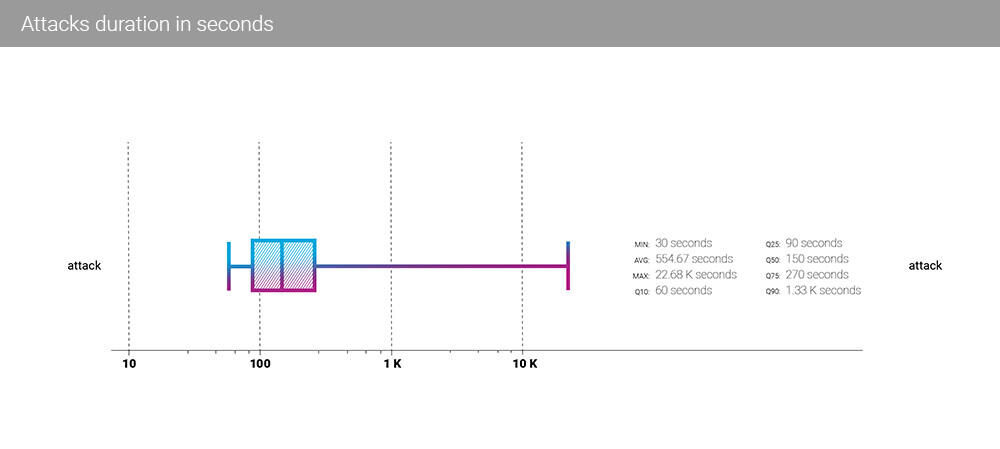
In Q3, the median attack time dropped to 150 seconds from 270 in Q2. The same happened with the average attack time, which fell to 555 seconds in Q3 from 1970 seconds in Q2.
Such a substantial fall in the attacks' duration is probably connected to the start of the business season, which could also be dubbed an attacking season.
With the ongoing growth of bandwidth and packet rate, the "spray and pray" tactics of DDoS attacks organizers reflect this “particular business's” reality. If the victim doesn't go "offline", it is cheaper to move on to other targets. The median attack time of 2.5 minutes is the lowest we ever observed.
As we mentioned earlier, the interchange between IP (fragments) flood and UDP flood quarter over quarter is somewhat highly expected. Additionally, we expect this trend to stay in the future.
The reason is, attackers are trying to improve the overall efficiency of their devices by choosing larger amplification targets (like DNS records), and it is pretty standard that those chunks of data significantly surpass the MTU limit. Thus fragmentation is inevitable.
Up to this moment, DDoS attacks have continued to grow in quantity and "quality" steadily for more than 25 years since the first SYN flood. The number of devices is also increasing tremendously, which means that amplification will always be a viable method for DDoS attacks. It leads us to the conclusion that L3 attacks will only continue to drift in the IP fragments' flood territory.
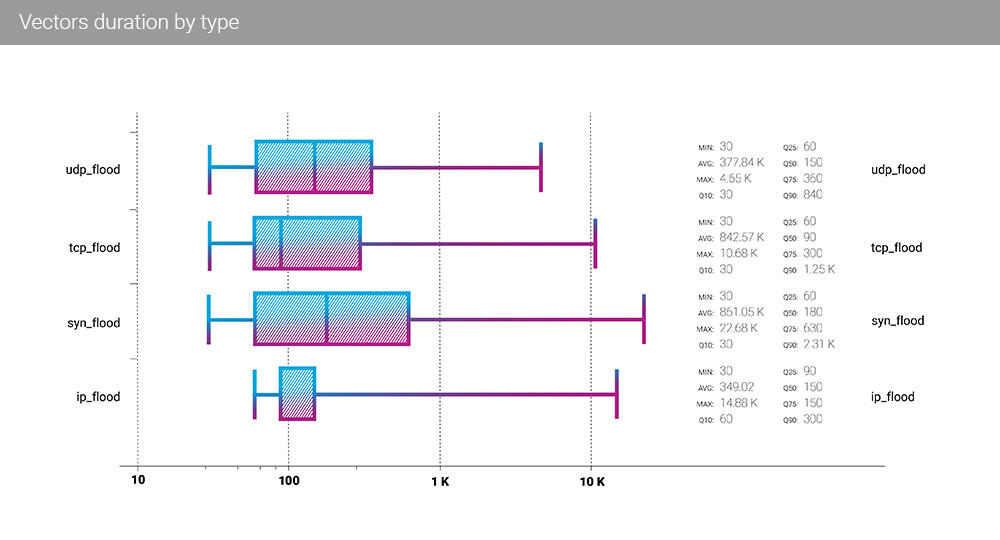
Comparing the individual attacking vector's duration with the Q2 data, we see right away that the leader changed as well. But in this case, it's not the IP flood but the SYN flood, which now has the most prolonged attacks duration among all the L3 attack types. SYN flood's average duration is more than 14 minutes, and the median duration is 3 minutes. Vice versa, for the IP flood, which, as we already wrote, was the most prominent attacking vector in Q3, the duration numbers are the smallest, with an average attack with IP flood continuing for a little less than 6 minutes and the median duration of 2.5 minutes. Although the TCP flood' median is even shorter (90 seconds), every other percentile is smaller precisely for the IP flood.
The maximum attack duration also falls into the SYN flood category, with a more than six-hour-long attack.
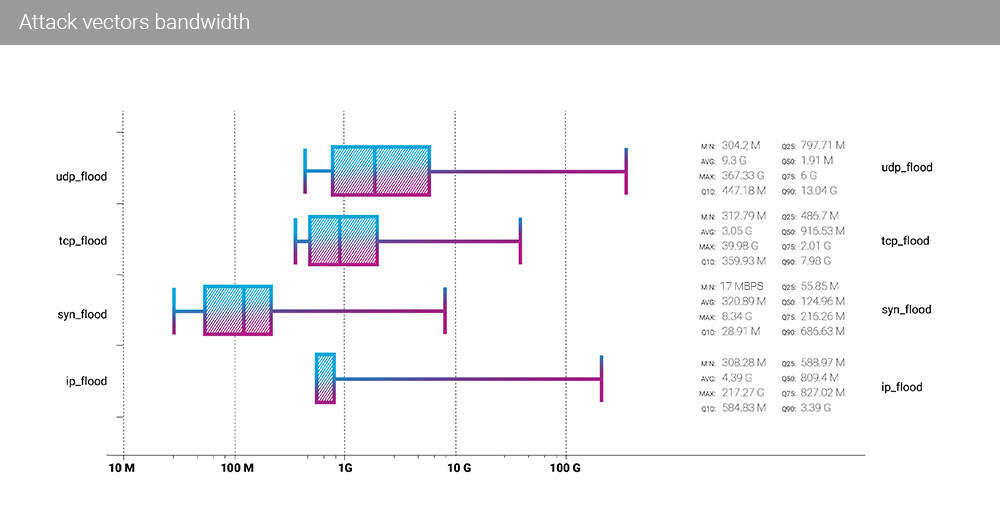
On the bandwidth side of DDoS attacks, the situation also changed quarter (3) over a quarter (2), but not that dramatically. SYN flood still, same as in Q2, has the lowest average bitrate among all the vectors - with a Q3 average of 320 Mbps, down from 514 Mbps average in Q2.
Although in Q2, the highest average bitrate belonged to IP flood, in Q3, UDP flood reigned the bitrate statistics with an average bandwidth of 9.3 Gbps. The median bandwidth of TCP flood (916.53 Mbps median) is still half of the UDP flood median of 1.91 Gbps.
Of course, we also wanted to register the further development of average attacking bandwidth quarter over quarter. To remind you of the metric, in Q2 2021, the average bandwidth of all DDoS attacks we mitigated was 6.5 Gbps.
In Q3 2021, the average bandwidth of all DDoS attacks we mitigated was 4.31 Gbps. This number is very close to the average attack bandwidth for Q4 of 2020, which was 4.47 Gbps, but is significantly lower than the Q1 2021 metric of 9.15 Gbps.
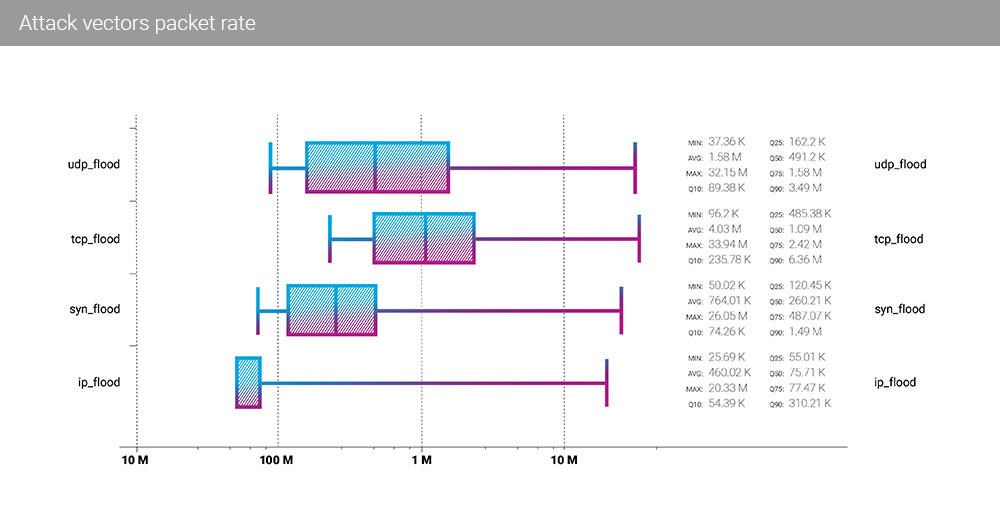
In Q3 2021, TCP flood finally got its first place in the packet rate statistics with the highest average (4.03 Mpps), median (1.09 Mpps) and the maximum (33.94 Mpps) rates. The minimum TCP flood packet rate is almost twice as big as the next vector - SYN flood - and 4x the IP flood.
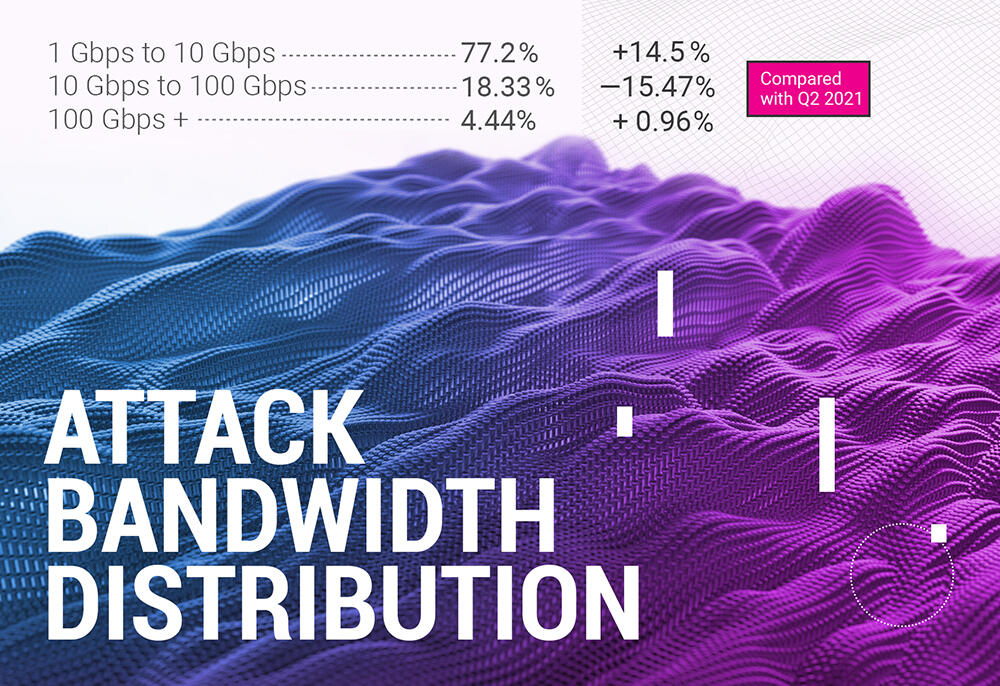
At the bandwidth distribution section of our quarterly report, there are also some significant changes evident. First of all, the dramatic shift of attacks into lesser bitrate territory, with 77.22% of all attacks residing in the 1 to 10 Gbps interval. Those were sucked into the lesser bitrate interval from the next one, 10 Gbps to 100 Gbps, which lost 15.47% of attacks.
However, the record-setting 100+ Gbps segment also gained another mass percentage, accounting for 4.44% of the total DDoS attacks in the third quarter of 2021.
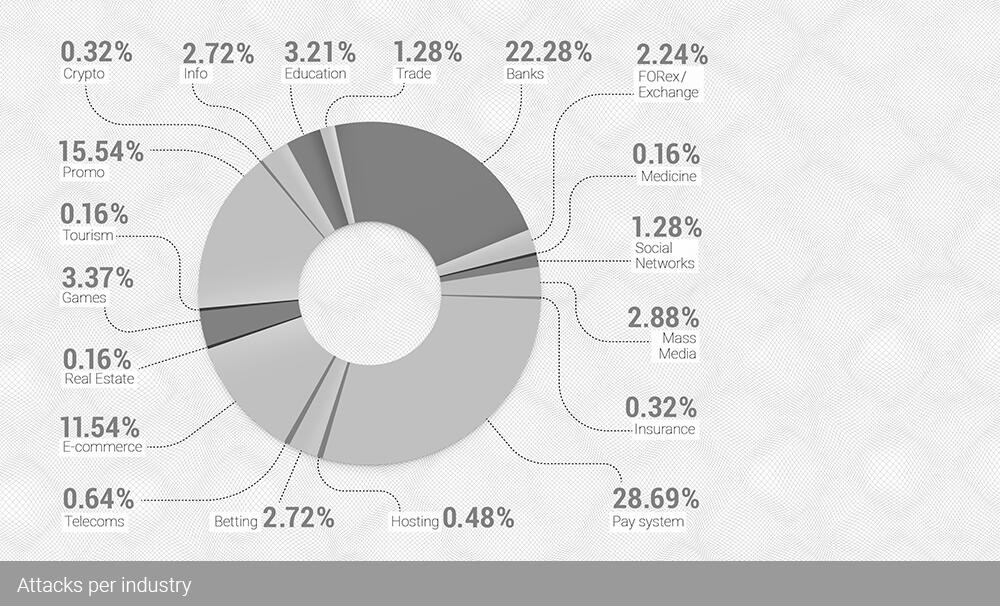
The real change in targets is visible when we take a look at the targeted industries. In Q2 2021, the most significant attacks were targeted at e-commerce, but in Q3 2021 we had two industries as targets for half of the mitigated attacks: Banks (22.28%) and Payment systems (28.69%). E-commerce fell from 19.97% in Q2 to 11.54% of all the attacks in Q3.
But with the banking sector, which attracted 18.47% more attacks Q3 over Q2, along with the payment systems sector, where attacks grew by 21.88% in the same period, are in a stressful situation.
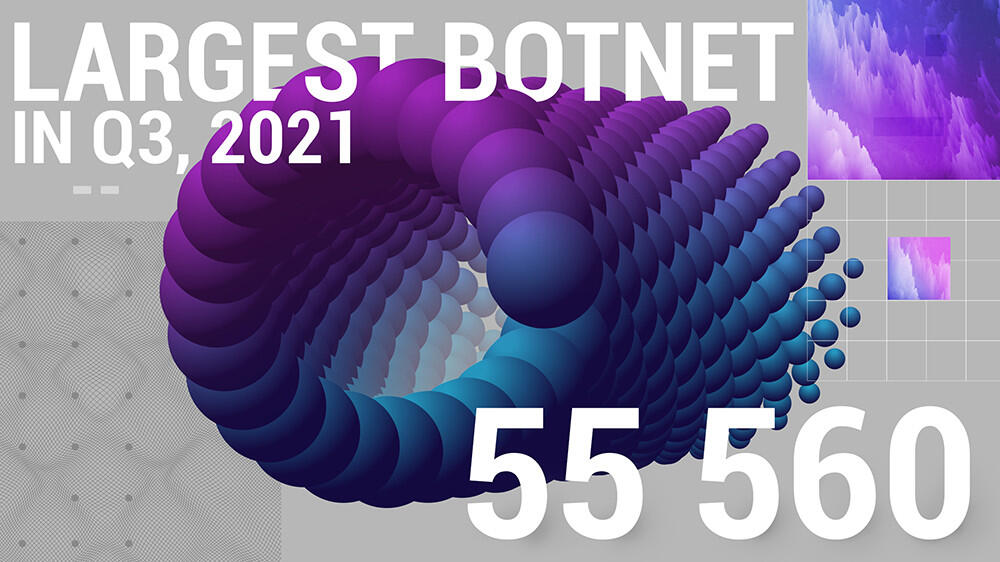
Largest botnet in Q3 2021, except for Mēris, counted 55 560 devices.
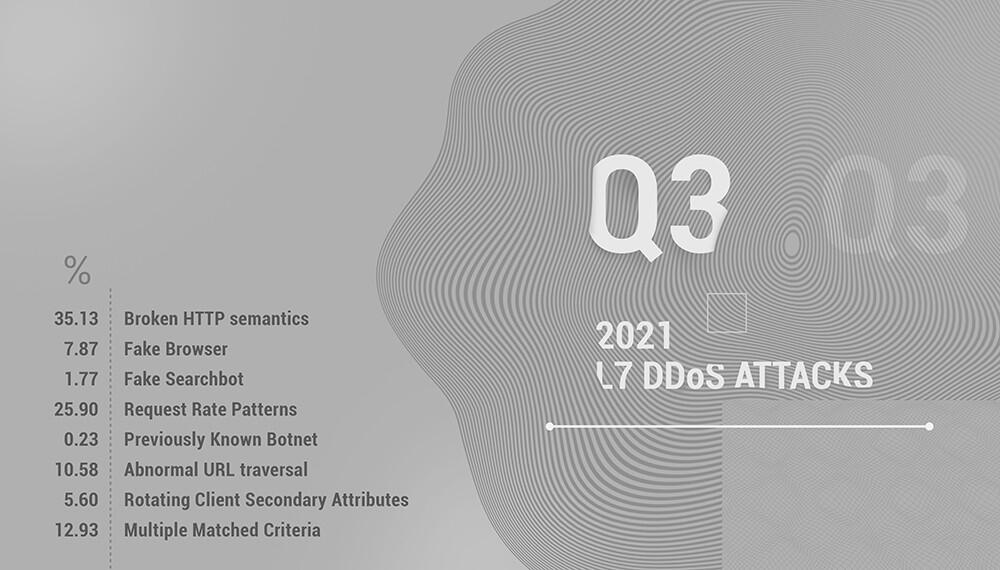
We would be honest here - this is our first public attempt to categorize application layer, or L7, DDoS attacks. Please don’t judge us harshly.
As you can see, the biggest category is Broken HTTP semantics. By “broken”, we mean different deviations from the usual or expected user’s behaviour.
Request Rate Patterns include everything that stands out from what is expected from a legitimate user in terms of request rate, analogically to the previous category.
That differs from the third category of Abnormal URL traversal, which is precisely what it sounds like - an action that a legitimate user often doesn’t even have the ability to make.
Those top three categories combined are responsible for 71.51% of the L7 attacks, with 12.93% in Multiple Matched Criteria, where we put all concurrent attacks.

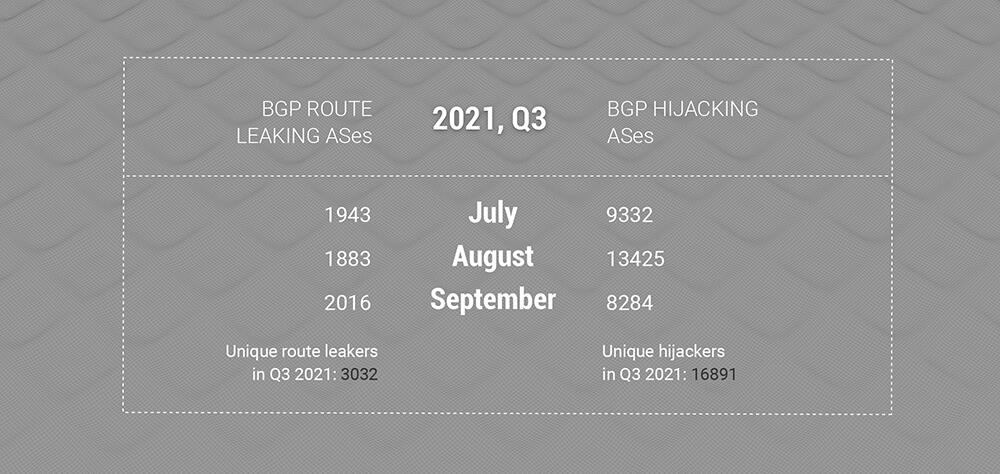
As always, there are a lot of BGP routes leaking and hijacking ASes. Specifically, the number of hijacking autonomous systems was not shrinking in Q3 and is neither historically, even considering a slight drop in July and September, and before that in April.
In 2021, Q1 was the only quarter where the number of unique hijacking ASes was somewhat lower than the rest of the year.
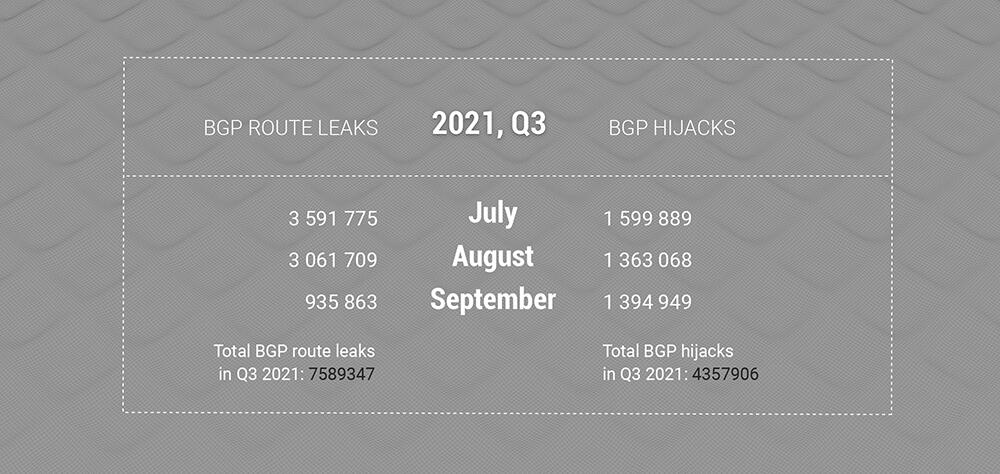
Significant change could be seen in the number of total BGP Hijacks. In the third quarter, we saw probably the lowest number of those for a long time of keeping a record: "only" 4 357 906 hijacks, which is approximately -35% compared with Q1 and Q2.
Hijacks were always a lesser evil, between them and route leaks, and easier to tame with the implementation of RPKI and ROA. It is great to see the number of hijacks slightly dropping, and we will confirm in the future if this was a seasonal fluctuation, or probably MANRS's effort of educating network operators and Internet companies is paying off.
But yet again, the number of unique hijacking AS stays somewhat the same as usual.
Now, let us look at the global incidents that are part of these statistics through each month of the quarter.
Reminder note: Qrator.Radar team has a set of certain thresholds that separate global incidents from the rest. They include affected prefixes, affected autonomous systems, and the incident's distribution among routing tables.
Global BGP Route Leaks:
July: 3
August: 1
September: 2
A detailed description of these incidents could be found according to the occurrence date in Qrator.Radar Twitter feed.
Global BGP Hijacks:
July: 0
August: 0
September: 1
Data sources and observation methodology
Qrator Labs' Quarterly and Annual Reports are based on the data from observed attacks on web pages and servers under the Qrator Labs' DDoS attacks mitigation service and customers insights on the mitigated attacks. The figures and data were collected according to the report's scope timeframe, i.e., a specific calendar quarter or calendar year.
Each report consists only of the attack data Qrator Labs directly observed ("mitigated"). Qrator Labs does not collect or analyze traffic outside of its network, meaning that all the conclusions we draw are based solely on the data passing through the Qrator BGP anycast network. By 2021 Qrator Labs anycast network exceeds 3 Tbps of filtering capacity built upon 14 points-of-presence, each connected to a Tier-1 ISP.
Qrator.Radar analyzes BGP paths data collected from more than 800 sessions, serving analytics and real-time incident monitoring to the registered and authenticated owners of Autonomous Systems. Qrator.Radar provides a user with historical data on AS connectivity (links), BGP routing anomalies, and network-related security issues.
Qrator.Radar is the BGP monitoring and analytics tool, as well as the vulnerability scanner for known networks.
That means that when scanning a network, Qrator.Radar analyzes the presence of any known amplificators and the amplification (https://en.wikipedia.org/wiki/Denial-of-service_attack#Amplification) factor itself. This data is further processed to give ISP (or, more precisely, ASN) owners the possibility to analyze the availability of any of those services, which attackers could exploit for DDoS attacks.
Such scans are not harmful in any way to the company's hardware or software, Qrator.Radar collects the data only to notify the rightful owners of the network of when and which amplificators became available within the networks they manage. We require authorization from the ASN owners before showing this kind of information we consider sensitive.
Besides the network data and its analysis Qrator Labs also employs open-source intelligence analysis within the public reports. Qrator.Radar, in turn, uses data from publicly available databases to get the IRR, RPKI and geolocation information to correlate between own and open-sourced data.