
With the end of the 2022' third quarter, we invite you to take a tour into DDoS attacks mitigation and BGP incidents statistics recorded from July to September.
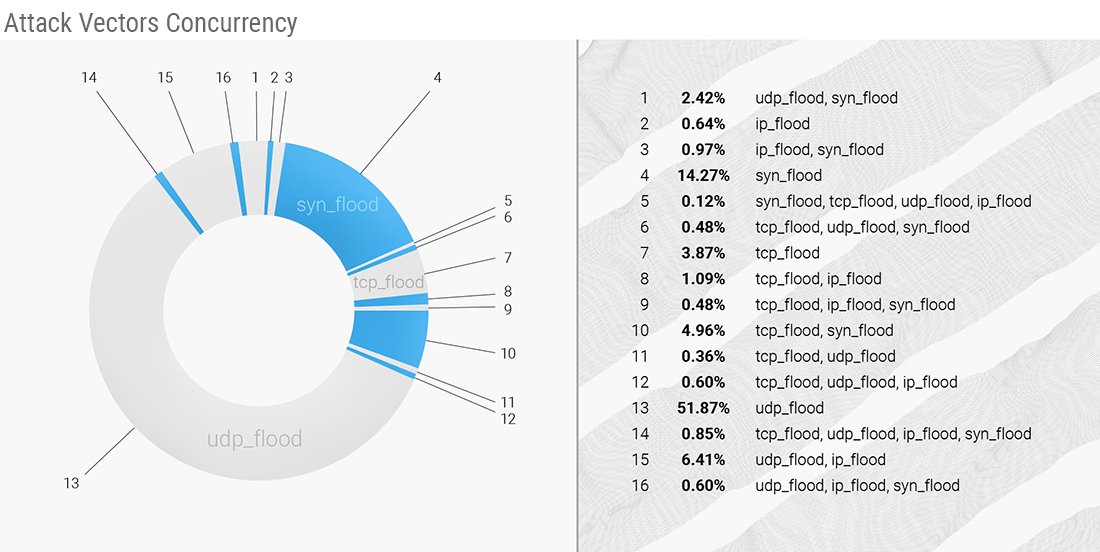
In the third quarter of 2022, attack vectors concurrency shows almost the same picture as in Q2. The following attack vectors were the largest in the third quarter of 2022:
- UDP flood, accounting for 51.87% of all the attacks;
- SYN flood, with a much smaller share of 14.27% of attacks;
- And finally, a tiny 3.87% belongs to the TCP flood.
UDP flood prevails among the exploited DDoS attack vectors since Q4 2021, except for Q1 2022, when SYN flood prevailed.
Surprisingly, in Q3, there were almost no IP flooding DDoS attacks - their share is meagre, only 0.64% of all the attacks. IP flood's share started shrinking last quarter; in Q1 2022 and Q4 2021, it was around 20-30%, and comparing Q3 2022 with Q3 2021, there's a dramatic change - down from 55.49% for the IP flood vector.
The top-3 vectors combined make 70.01% of all the mitigated DDoS attacks in Q3 - seven percent less than in the previous quarter. That is due to the growth in some vector combinations:
- 6.41% of UDP flood combined with IP flood;
- Almost 5% of TCP flood combined with SYN flood;
- Slightly smaller, 2.42% for the UDP flood and SYN flood.
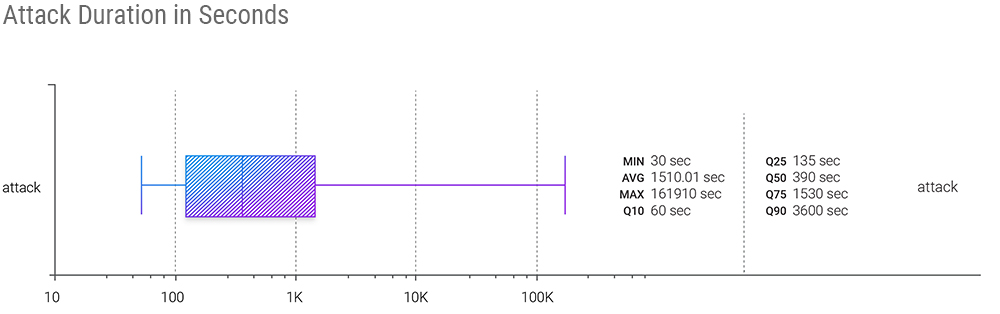
Comparing attack duration data QoQ, it is evident that the average and maximums have significantly dropped: average from 5 340 seconds in Q2 to 1510 seconds in Q3, and maximum from 392 040 seconds in Q2 to 161 910 seconds in Q3.
However, the median (Q50) attack time remains unchanged - precisely the same as last quarter at 390 seconds per attack.
Looking at Q75 and Q90, we can also state that Q3 attacks were shorter in duration than Q2 2022.
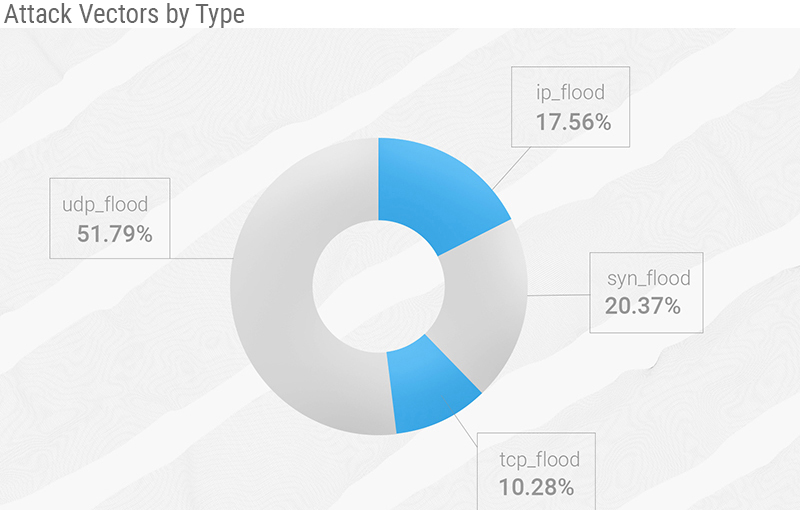
In the clean (without concurrency) attack vectors, we see, once again, the dominance of the UDP flood over other techniques.
Interestingly, TCP flood with 10.28% of the mitigated attacks is at its highest point in our observation, getting much closer in terms of exploitation to the IP (fragments) flood. And the SYN flood vector is at its lowest with "only" 20.37% of the attacks.
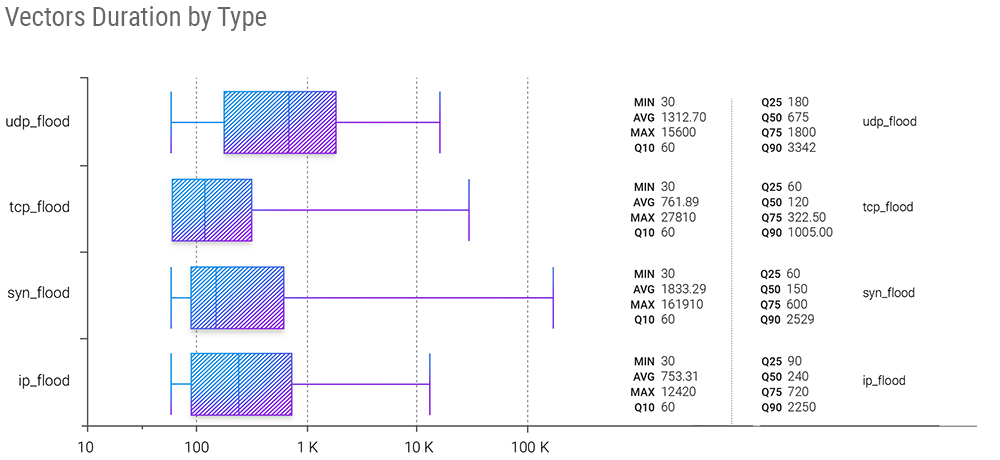
In the individual vectors' duration snapshot, we also see some interesting changes compared with Q2 2022. The picture we see here is almost identical to the Q3 2021 - back then, the SYN flood also showed the most extensive maximum duration, but then it was followed by the IP flood, not the TCP flood as it is in Q3 2022. IP flood lost some significant duration weight QoQ.
At the same time, we can state that UDP floods have the largest Q75 and Q90, which makes UDP attacks the prolonged ones in the real world.
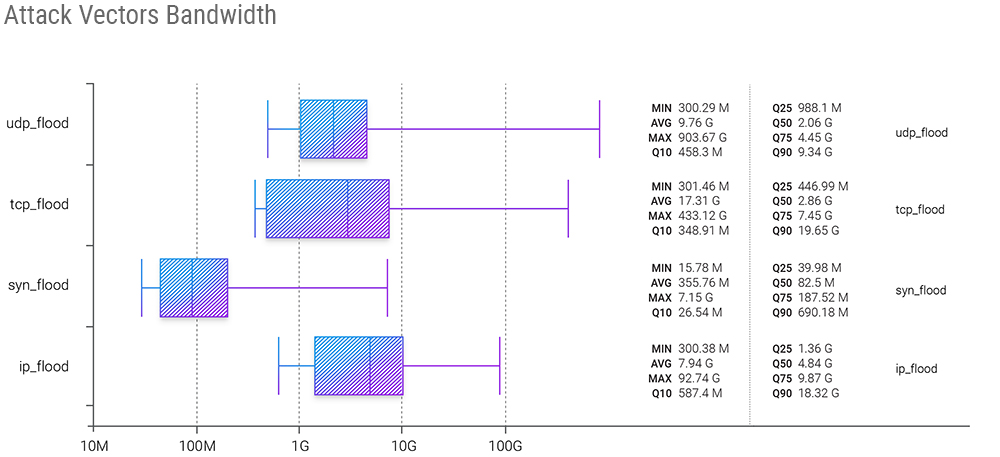
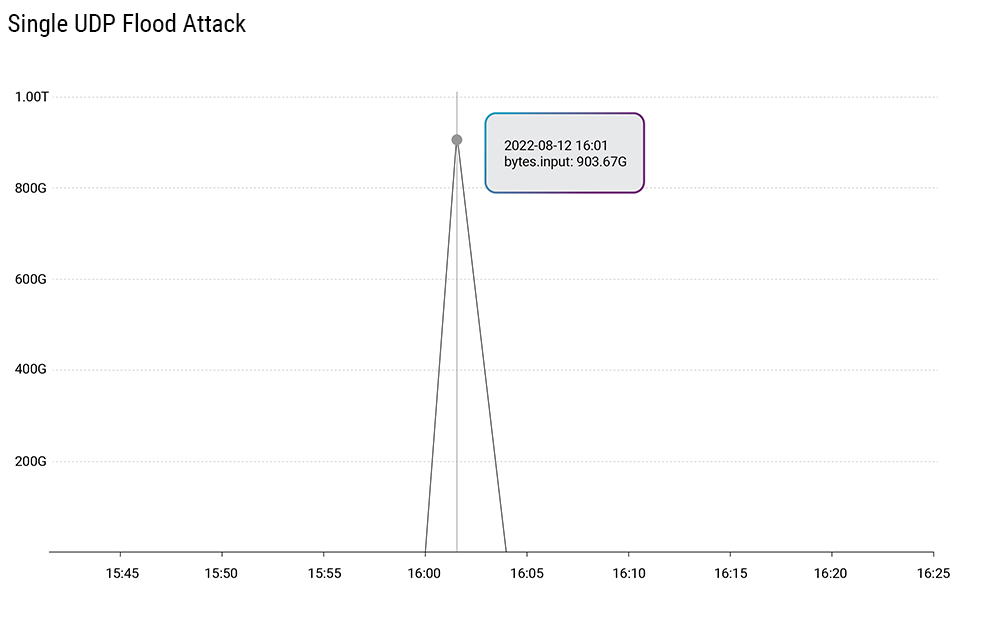
In the attack vectors bandwidth statistics, we can see a Q3 record of a single attack that exploited the UDP flood vector to get a whopping 903.67 Gbps.
In the previous quarter, we wrote that for the first time in our observations, TCP flood showed numbers larger than UDP flood - now it's back to "usual", with UDP flood commanding the bandwidth statistics and TCP flood attack bandwidth following in second place.
But on the median (Q50) side of things, IP (fragments) flood shows the most significant numbers, followed by TCP flood.
Also, note how narrow the Q10-Q90 range became for the UDP flood - from 458.3 Mbps for Q10 to 9.34 Gbps for Q90. Previously, this was the case for the SYN flood, where you don’t need as much bandwidth because of the small packet size.
In the quarterly reports, we register the development of average (L3 - L4) attacking bandwidth quarter over quarter. Last quarter - Q2 2022, the absolute average was 5.17 Gbps, slightly more than half of the largest average bandwidth - 9.15 Gbps in Q1 2021. In Q3 2022, the average attack bandwidth was 8.30 Gbps - almost as high as the record. These numbers are valid for volumetric attacks only.
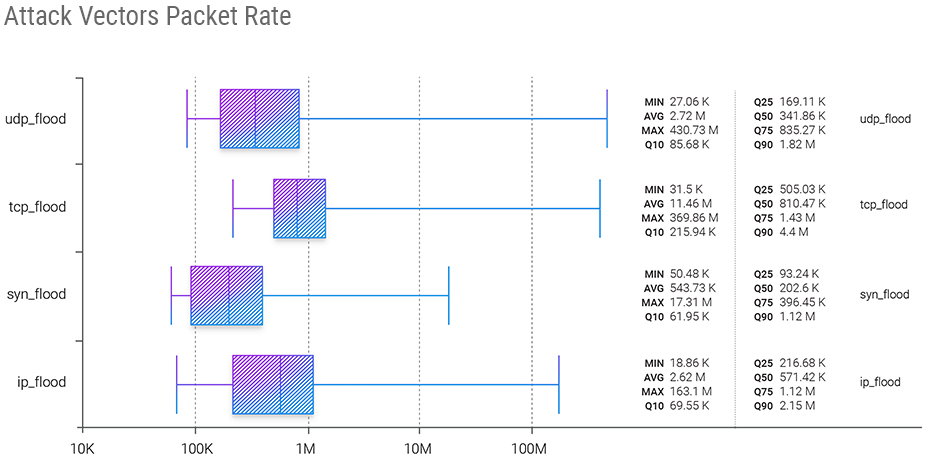
The trend continues on the packet rate of attacks - UDP flood demonstrates the highest maximum number, quarter after quarter. In Q3 2022, it was 430.73 Mpps. And the same as in the previous quarter, TCP flood shows the most significant average (11.46 Mpps) and median (810.47 Kpps).
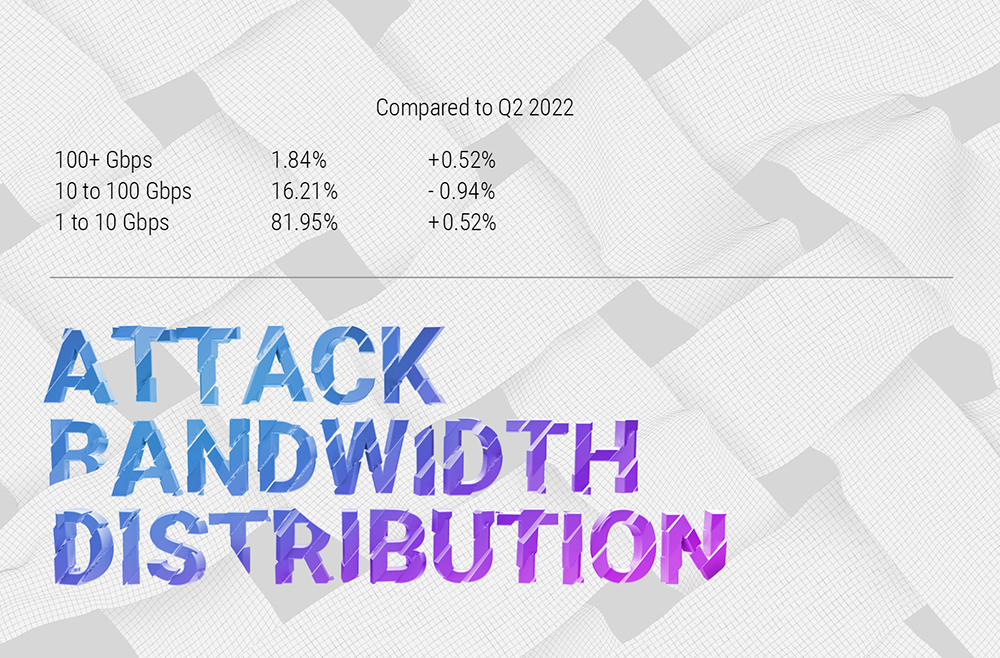
In Q3 2022, the "central" range of 10 to 100 Gbps lost some percentage points which were redistributed among lower and higher bandwidth ranges, with more than half going to the higher degree. After the dramatic change between Q4 2021 and Q1 2022, things look settled, with over 80% of the attacks falling into the "smallest" attack bandwidth category of 1 to 10 Gbps.

In Q3 2022, the most significant attack source numbered slightly more than 115 thousand devices - a visible increase from Q2's 84 000 devices but a fraction of the record-setting attacking network consisting of almost 1M devices we encountered in Q1 2022.
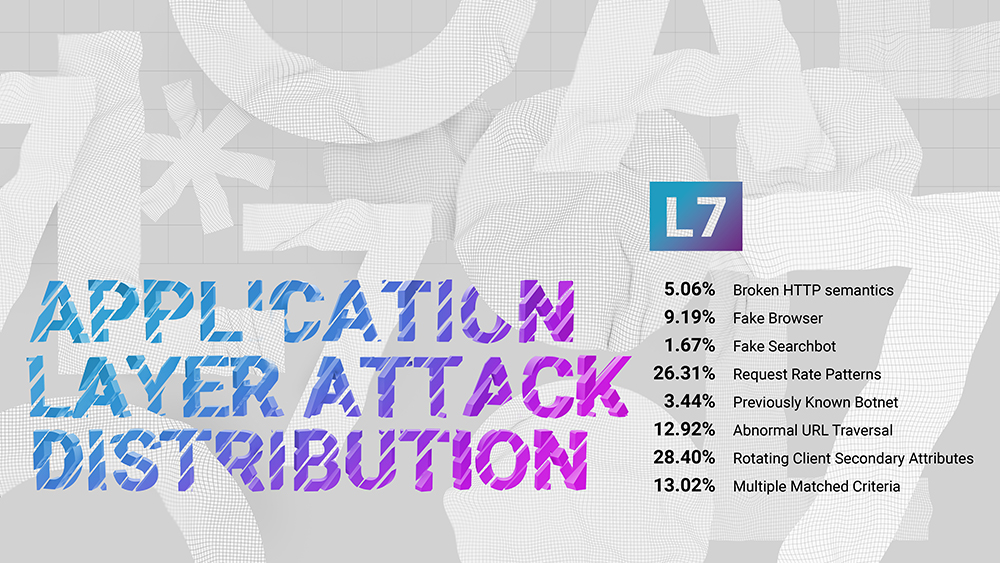
Q3 2022 is the fifth quarter in a row when we attempt to categorize the application layer, or L7, DDoS attacks.
Same as in Q2, in Q3, the largest category is Rotating Client Secondary Attributes, which refers to an unusual set of headers in the request, and accounts for more than a quarter - 28.40% of L7 DDoS attacks.
It is followed by Request Rate Patterns, which include anything that stands out from what is expected from a legitimate user in terms of request rate and collected 26.31% of Q3 2022 application layer attacks.
That differs from the third category of Abnormal URL traversal, which is precisely what it sounds like - an action that a legitimate user often doesn't even have the ability to take, where we saw 12.92% of attack data.
Broken HTTP Semantics now amasses “only” 5.06% of L7 attacks.
Those top four categories combined are responsible for 72.69% of the L7 attack, with 13.02% in Multiple Matched Criteria, where we put all concurrent L7 attacks.

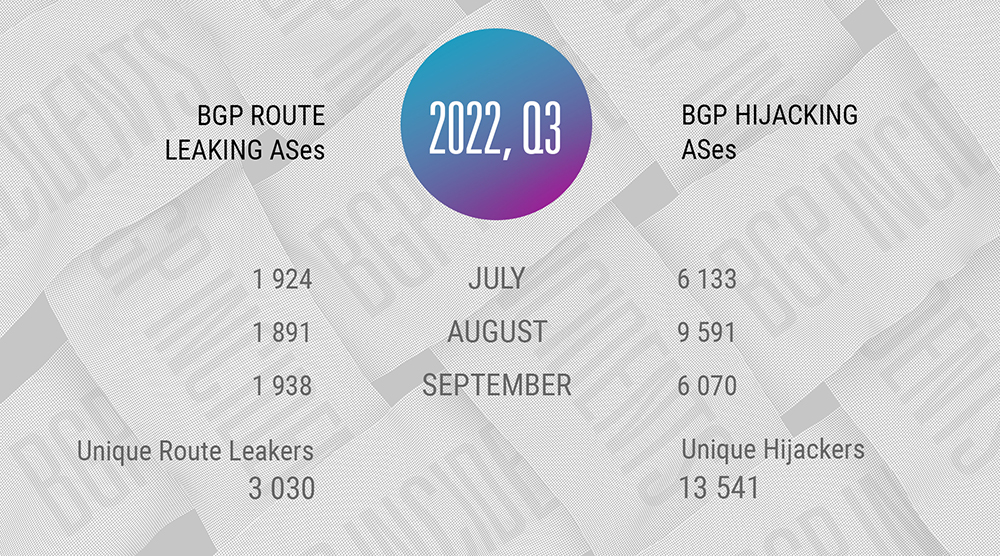
Looking at the number of unique BGP route leakers and unique BGP hijackers, it seems that nothing is happening - which is far from the truth. Although the number of unique leakers is almost the same as in the previous quarter - with the difference of only 116 leaking ASes, and the number of unique BGP hijackers grew ⅓ QoQ, we're getting back to the reality of BGP incidents.
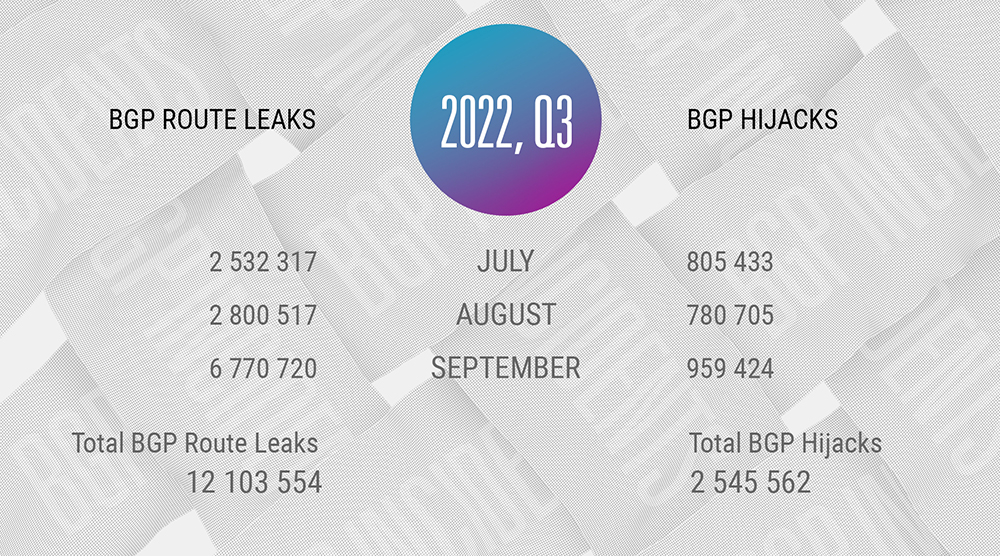
Remember, here, we are counting the total number and not the unique routing incidents - if one AS originates a route leak, that is distinguished as a separate one by the Qrator.Radar model - we count it in.
In Q3 2021, Qrator.Radar recorded 12 103 554 individual BGP route leaks - the number as high as it was in Q1 2022. And the reality is that the number of route leaks jumped back to where it was before the previous, somewhat anomalous quarter.
Total BGP Hijacks in Q3 is 2 545 562 - less than 5% of Q2's astonishing 61M+ hijacks, but as we mentioned, in the previous quarter, the total hijack count was heavily affected by exclusively individual autonomous systems.
Now, let us look at the global incidents that are part of these statistics through each quarter month.
Reminder note: Qrator.Radar team has a set of certain thresholds that separate global incidents from the rest. They include affected prefixes, affected autonomous systems, and the incident's distribution among routing tables.
Global BGP Route Leaks in Q3 2022:
July: 0
August: 3
September: 3
One could find a detailed description of these incidents according to the occurrence date in the Qrator.Radar Twitter feed.
Global BGP Hijacks in Q3 2022:
July: 1
August: 2
September: 0
Data sources and observation methodology
Qrator Labs' Quarterly and Annual Reports are based on the data from observed attacks on web pages and servers under the Qrator Labs' DDoS attacks mitigation service and customers’ insights on the mitigated attacks. The figures and data were collected according to the report's timeframe scope, i.e., a specific calendar quarter or calendar year.
Each report consists only of the attack data Qrator Labs directly observed ("mitigated"). Qrator Labs does not collect or analyze traffic outside of its network, meaning that all the conclusions we draw are based solely on the data passing through the Qrator BGP anycast network. By 2022 Qrator Labs' anycast network exceeded 3 Tbps of filtering capacity built upon 15 points-of-presence, each connected to a Tier-1 ISP.
Qrator.Radar analyzes BGP paths data collected from more than 800 sessions, providing analytics and real-time incident monitoring to the registered and authenticated owners of Autonomous Systems. Qrator.Radar provides a user with historical data on AS connectivity (links), BGP routing anomalies, and network-related security issues.
Qrator.Radar is the BGP monitoring and analytics tool and the vulnerability scanner for known networks.
That means that when scanning a network, Qrator.Radar analyzes the presence of any known amplificators and the amplification (https://en.wikipedia.org/wiki/Denial-of-service_attack#Amplification) factor itself. This data is further processed to give ISP (or, more precisely, ASN) owners the possibility to analyze the availability of any of those services which attackers could exploit for DDoS attacks.
Such scans are not harmful in any way to the company's hardware or software, Qrator.Radar collects the data only to notify the rightful owners of the network of when and which amplificators became available within the networks they manage. We require authorization from the ASN owners before showing this kind of information we consider sensitive.
Besides the network data and its analysis Qrator Labs also employs open-source intelligence analysis within the public reports. Qrator.Radar, in turn, uses data from publicly available databases to get the IRR, RPKI and geolocation information to correlate between its own and open-sourced data.