DDoS Attacks by Vectors
The third quarter of 2023 was marked by a series of interesting findings and the confirmation of some trends that we observed in the previous quarter.
Let's start with the distribution of attack vectors by quantity. Over the past quarter, the trend of an increasing number of UDP flood attacks continued to gain momentum, setting a new record at 66.92% of the total attacks in mixed values and 64.13% in absolute values. Compared to the second quarter of this year, this figure increased by 6.82%, and compared to the same period last year, it increased by 14.73%.
Recall that in the previous report for the second quarter of 2023, we identified a trend of a steady increase in the number of UDP flood attacks. We attributed this to two main reasons. Firstly, the change in the infrastructure of most businesses and the transition to UDP with the DTLS protocol to improve performance and scalability. Secondly, the expansion of internet channels in the context of the growing trend of remote offices and the implementation of additional communication tools. Thirdly, a change in the behavior pattern of malicious actors who increasingly use UDP as a cheaper and easier method of attack.
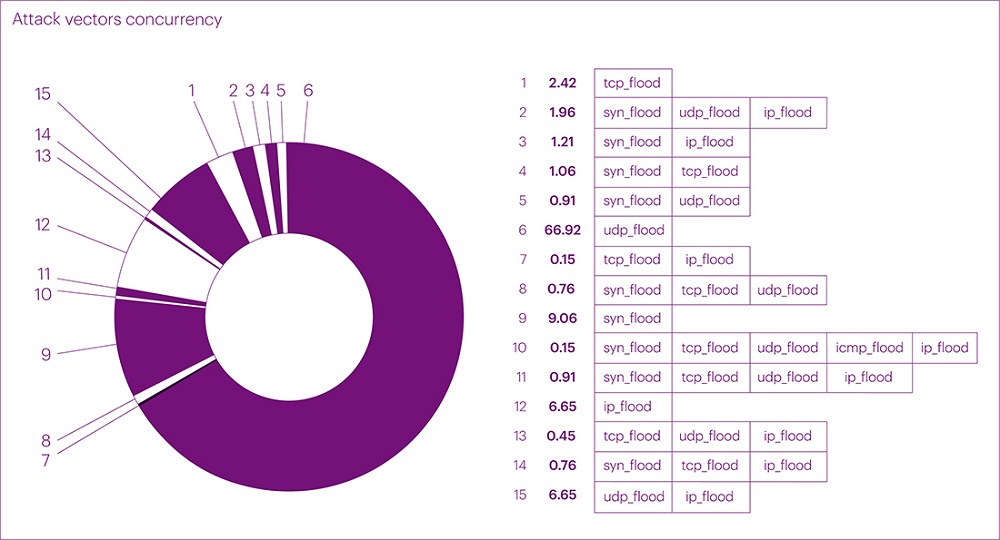
In general, the distribution of mixed attacks by vectors looks as follows:
- UDP flood: 66.92%
- SYN flood: 9.06%
- IP flood: 6.65%
- TCP flood: 2.42%
Multivector attacks (two or more vectors) occupy the second position in this distribution, accounting for 14.96% of all attacks. Compared to the previous quarter, this figure increased by only 5.8% due to the slower growth of simple attacks. However, it's the complex (mixed) attacks in the current quarter that have stood out for their longer duration and higher bandwidth.
In the statistics of the net distribution of attack vectors, the positions are also not significantly different:
- UDP flood: 64.10%
- SYN flood: 14.25%
- IP flood: 15.75%
- TCP flood: 5.90%
Compared to the previous quarter, the changes in the ratio of attack vectors are minor, within 10%, and are not related to the dynamics of the overall number of attacks. For the third consecutive year, we have observed a seasonal decrease in the total number of attacks in the third quarter. In 2021, the quarter-to-quarter decrease was 16.45%, in 2022 it was 10.77%, and this year it decreased by 13.46%. This is another indication of the changing behavior pattern of malicious actors towards UDP.
Duration of Attacks
The duration of attacks in the third quarter underwent changes compared to the second quarter. For example, the average duration of attacks was 66 minutes, which is 19 minutes longer than the second-quarter figure and comparable to the first-quarter figure.
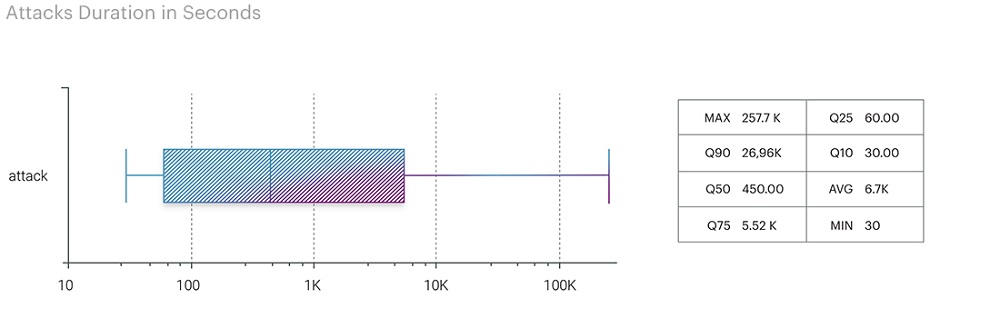
However, the maximum duration of attacks set a new record for this year, surpassing even the fourth quarter of the previous year, where the longest attack lasted almost 70 hours. At the end of August, there was an attack on the Transportation and Logistics segment (airports), becoming the longest continuous attack of this year, lasting nearly three days (71 hours and 58 minutes). It's important to note that this was a complex, multivector attack – UDP+SYN+TCP.
As a result of the third-quarter data analysis, the duration of attacks was distributed as follows:
- UDP flood - 71.58 hours
- SYN flood - 70.73 hours
- IP flood - 22.5 hours
- TCP flood - 13.29 hours
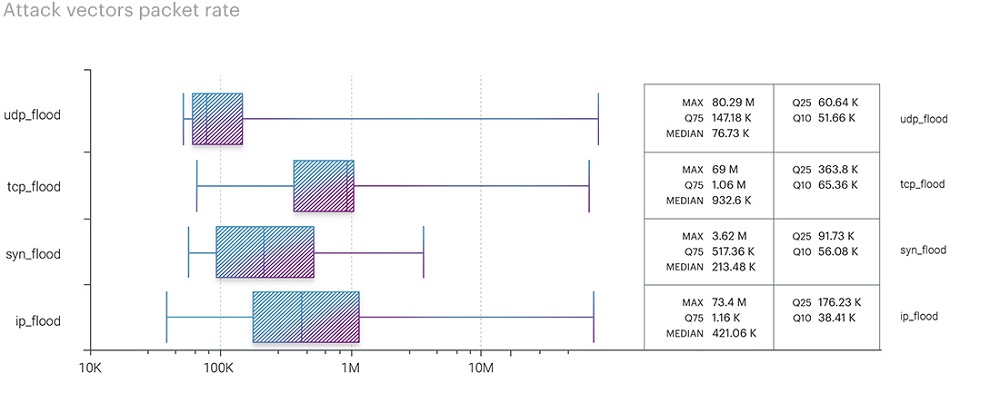
Attack Vectors: Bandwidth
The third quarter brought the bitrate levels back to those of the first quarter, displacing TCP flood, which held the leading position in the second quarter with a maximum bitrate of 333.78 Gbps. The peak bitrate for UDP flood reached 675.22 Gbps, only 15 Gbps lower than the first-quarter figure (690.23 Gbps). At the same time, the IP flood bitrate set a new high for the past nine months at 607.76 Gbps, which is more than six times higher than the figures from the previous two quarters (83.49 Gbps in the first quarter and 97.15 Gbps in the second quarter).
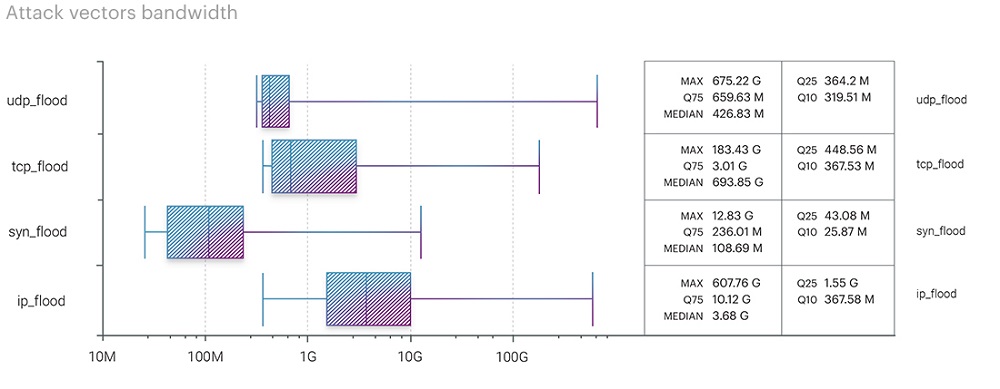
An interesting discovery was the ICMP flood's peak bitrate, reaching 114.65 Gbps as part of a multivector attack on hosting platforms in the IT and Telecom segment. In contrast, the maximum TCP bitrate decreased even further to 183.43 Gbps, compared to 471.21 Gbps in the first quarter and 333.78 Gbps in the second one.
- UDP flood - 675.22 Gbps
- IP flood - 607.76 Gbps
- TCP flood - 183.43 Gbps
- ICMP flood - 114.65 Gbps
- SYN flood - 12.83 Gbps
The ranking of attack vectors based on packet intensity metrics changed the leader. UDP flood, which held the first position with 69.55 Mpps in the previous quarter, slipped to the second position with 80.29 Mpps, yielding the top spot to ICMP flood with 155.78 Mpps. However, this is more of an exception to the rule, just like the peak ICMP bitrate at 114.65 Gbps. The increased ICMP flood rate, similar to the bitrate, was due to a multivector attack on hosting platforms in the IT and Telecom segment, which lasted only a few minutes. Therefore, this fact should not be considered an emerging trend.
In the previous quarter, we observed another trend - an increase in attack bitrates in the future due to channel expansion and cost reduction in organizing the attacks themselves. The return of UDP bitrates to early-year levels aligns with our expectations.
We continue to monitor the development of this trend, but it can be said now that over the last three years, the average figures for different attack vectors have changed. For example, the IP flood bitrate, with an average peak in the first three quarters of 2021 at 511.74 Gbps, has decreased to 262.80 Gbps over the first three quarters of this year. In contrast, the average peak bitrates for UDP continue to rise. Based on historical data for the first three quarters of 2021, 2022, and 2023, the trend is as follows:
- 2021 - 282.03 Gbps on average at peak
- 2022 - 537.60 Gbps on average at peak
- 2023 - 553.03 Gbps on average at peak
Even with the anomalous traffic spike in the third quarter of 2022 reaching 903.67 Gbps, it is evident that the average peak UDP bitrate has been steadily increasing from year to year, rarely falling below 600 Gbps at its peak.
DDoS Attacks: Segmentation
Distribution of Attacks by Industries (Attacks by segment)
Similar to the previous quarter, the financial sector was the hardest hit, accounting for 42.06% of all attacks in the third quarter of 2023. The e-commerce segment took second place, representing 29.80% of the attacks. The IT and Telecom segment came in third with 6.05%. The educational technology segment ranked fourth this time with a percentage of 5.9%, which is 5.36% lower than the previous quarter. The top five most targeted segments were rounded out by the media sector at 4.99%.
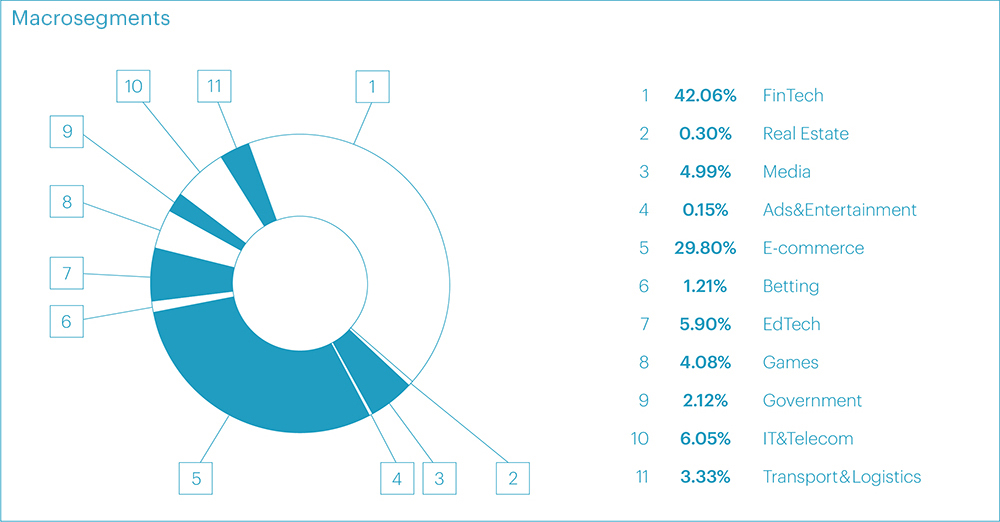
However, it's worth noting another segment deserving special attention in this quarter - Transportation and Logistics, which experienced attacks in only 3.33% of cases but became notable in a different context, as we explain below.
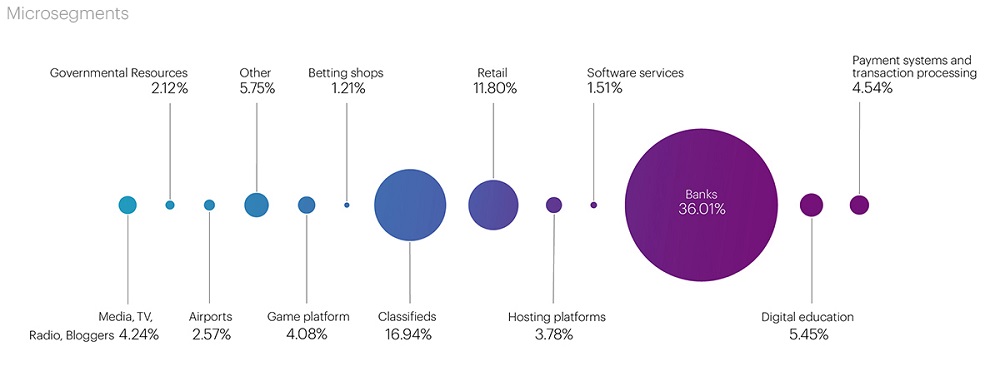
Looking at micro-segments, we see the following breakdown:
Throughout the year, the quarterly ranking of the top three most targeted segments was distributed as follows:
| Q1’23 | Q2’23 | Q3’23 | |
| 1 | Classifieds | Baks | Banks |
| 2 | Digital education | Digital education | Classifieds |
| 3 | Payment systems | Classifieds | Retail |
Based on the results of the three quarters of 2023, the most frequently targeted micro-segment became Banks (Financial sector) with 27.74% of all attacks over the 9 months. In the second position were Classifieds in the E-commerce segment at 16.16%, and the third spot was occupied by the Digital education segment at 9.5% of all attacks. The top five leaders also included the Payment systems segment at 6.71%, with the Retail and Media segments almost evenly sharing the fifth position at 4.53% and 4.78%, respectively. These segments are the primary targets for attackers this year.
Distribution of Attacks within segments by Duration
The presence of Banks, Classifieds, and Retail among the top three most targeted micro-segments can be attributed to preparations for the fall season. In banks, this relates to autumn deposit and loan offers, while in e-commerce, it involves preparations for the back-to-school season and the launch of marketing campaigns and sales.
As for airports in the Transportation and Logistics segment, which we highlighted earlier, although it occupies the last position in our list of the most targeted segments, it experienced the longest continuous multivector attack of the current quarter. Although it was relatively small in volume, peaking at just 5.94 Gbps (UDP flood), the attack began on August 24 with three vectors: TCP flood, which lasted for one day, UDP and SYN flood, which continued until August 27. In total, the attack lasted for almost three days (71.58 hours of UDP flood and 70.73 hours of SYN flood simultaneously). Overall, in our view, this attack has the characteristics of a commercial (ordered) attack.
The second-longest attack in terms of duration was recorded in September in the Food Retail segment, lasting over 22 hours. This attack not only ranked second among the longest continuous attacks but also entered the top five in terms of peak intensity, with a bandwidth of over 100 Gbps. The reason for this attack, in our opinion, was a massive marketing campaign launched by one of the fast-food chains.
In terms of the attacks duration, the segments were ranked as follows:
- Airports - 2.98 days
- Food retail - 22.63 hours
- Banks - 10.23 hours
- Hosting - 9.63 hours
- Government Portals - 7.8 hours
The longest intermittent attack was recorded in the online gaming segment. The attack, targeting the same domain, began on July 26 and ended on August 1, lasting a total of one week. There were breaks of no more than 15 hours between traffic surges. The attack's peak bitrate reached 183.43 Gbps, with a packet intensity of 15.49 Mpps.
In August, another online gaming platform experienced several attacks, peaking at 99.54 Gbps. These attacks targeted the same domain with intervals of several days (from August 12 to 29) using various vectors (UDP + SYN + IP). The average attack bitrate was 25.58 Gbps.
In all three of these cases, the peak bitrate values were achieved primarily through UDP flood, once again confirming our hypothesis about the increase in attack bandwidth due to many companies transitioning to UDP.
Distribution of Attacks within segments by Bandwidth
As for bandwidth, the most powerful series of attacks were recorded in the IT and Telecom segment, targeting a hosting platform. The multivector attack began on August 20, and traffic intermittently flowed in relatively small volumes until September 1. There was then a two-week break, and on September 14, the domain was attacked simultaneously in four vectors with peak loads, reaching record values for the current quarter in three of the four vectors: UDP - 675.22 Gbps, IP - 607.76 Gbps, ICMP - 114.65 Gbps, TCP - 55.14 Gbps (not the highest value of the quarter).
The top three segments also included online gaming and media. In terms of bandwidth, the other segments were ranked in the following order:
- IT and Telecom: Hosting platforms - 675.22 Gbps
- Online gaming: Gaming platforms - 183.43 Gbps
- Media: TV, Radio, Media - 144.97 Gbps
- E-commerce: Food retail - 101.5 Gbps
- Finance: Payment systems - 68.85 Gbps
As seen from the list, the media segment, which occupied the first position in the previous quarter (333.78 Gbps), ended up in the third position, and the betting segment didn't make the list at all (it held the second position with a rate of 293.64 Gbps).
All the above-mentioned cases, in our view, exhibit characteristics of commercial attacks, which have been regaining popularity this year. This is not surprising since we have previously discussed observed trends related to expanding communication channels, transitioning to new protocols to optimize the operation of remote offices. Add to this the ease and low cost of organizing DDoS attacks, and we have an effective tool for influencing businesses for malicious actors, with all the resulting consequences: reputational risks, direct financial losses, lost profits, disrupted marketing campaigns, resources spent on restoring system functionality, and more.
Geographical Distribution of Attack Sources
The statistics on the distribution of attacks by geographical sources in the third quarter confirm another trend that we identified in the second quarter - to bypass geo-blocking, malicious actors have become more active in using local traffic sources, as close as possible to the regions of their targets.
The total number of blocked IP addresses increased by 116.42% compared to the second quarter, from 18.5 million to 40.15 million.
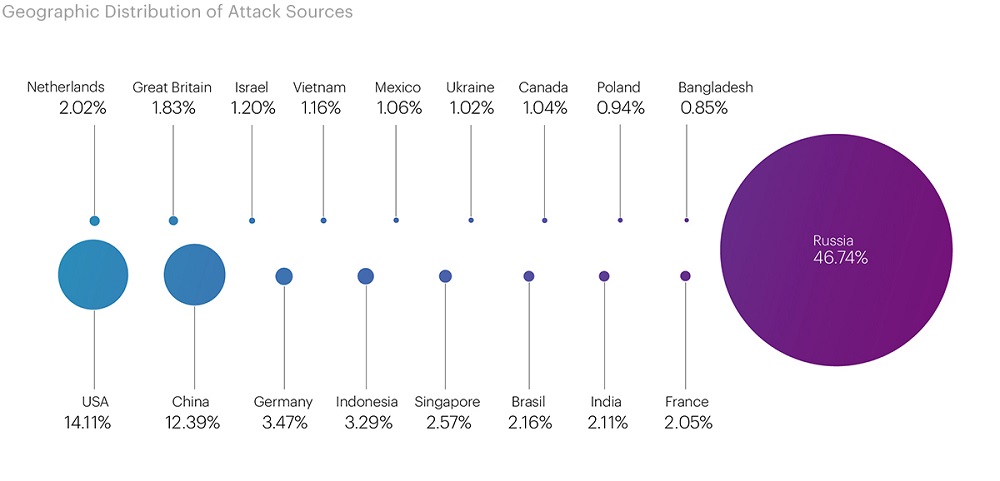
As in the previous quarter, Russia topped the list, where 18.7 million addresses were blocked, which is nearly half of the total number of blocked IPs (46.74%). In the top 3, we have the USA and China again, with 5.66 million (14.11%) and 4.97 million (12.39%) blacklisted, respectively.
Germany (1.39 million), Indonesia (1.32 million), Singapore (1.03 million), Brazil (867,000), India (847,000), and France (822,000) still remain on the list of leaders in terms of the number of blacklisted IP addresses.
Additionally, there are newcomers on our list compared to the previous quarter. For instance, Bangladesh, Israel, and Poland recorded 340,000, 483,000, and 377,000 blocked IP addresses, respectively.
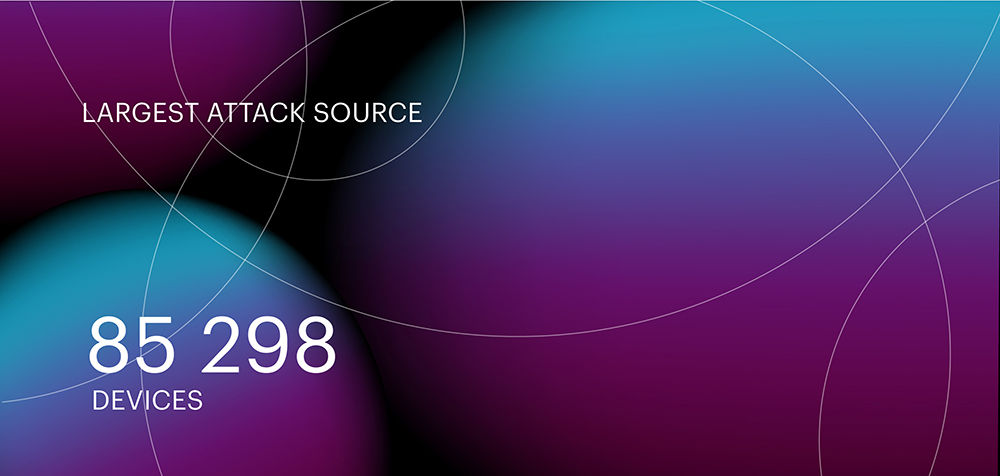
The Largest Botnet
Compared to the second quarter of 2023, the figure for the largest botnet we detected during the research period decreased by almost half, totaling 85,298 devices from 20 countries (compared to 136,590 devices in the second quarter). The botnet attack was recorded on August 10th in the Payment Systems segment. The largest number of botnet devices was observed in India – 10,671 devices. The top 5 also included Indonesia (10,092 devices), Russia (9,757 devices), the USA (8,361 devices), Iran (6,497 devices), and Vietnam (5,786 devices).
Application Layer Attacks (L7 OSI Model)
In the third quarter, the number of application layer attacks continued to decrease. This time, the indicator dropped by 26.67% compared to the second quarter of the current year. In total, the reduction in the share of L7 attacks amounted to 34% compared to the first quarter of 2023.
To increase the number of L7 attacks, vulnerabilities that allow for the creation of cost-effective L7 attacks with the ability to generate a large number of requests per second are needed. Without vulnerabilities, the cost of organizing attacks is very high because renting real devices and creating a botnet from them is very expensive. Additionally, one needs to be certain about how to bypass the victim's defense mechanisms and whether it is economically viable for the attacker.
This is why such attacks are not mass-scale but rather highly targeted.
Generating a large number of requests from a small number of devices is possible if the infected device is sufficiently powerful for this purpose. For example, one can rent or infect an IP with a dedicated server or a virtual server, from which it's possible to generate from a few hundred to several thousand requests. Attacks of this kind are relatively easy to detect and neutralize by cloud protection providers that analyze Application level traffic (L7).
With the advent of the new version of the HTTP/2 protocol, it has become possible to generate hundreds of requests within a single TCP session, simultaneously targeting different elements of the attacked resource. The new protocol has almost no limitations on the number of requests within a single TCP session, allowing malicious actors to remain relatively inconspicuous at the provider's L3-L4 protection level. Even behavioral analysis at the L4 level may not always identify such an attack, considering it as normal protocol behavior.
Additionally, through L7 attacks, malicious actors can force the victim's resources to horizontally scale, thereby significantly increasing the bill for cloud resources. Such attacks are often organized against companies renting servers in the cloud.
By formal criteria, the victim's resources do not degrade during the attack because as traffic volumes increase, the server instantly scales. However, at the end of the month, this can result in significant financial losses for the customer, as the cost of resource utilization in the cloud can increase the bill several times.
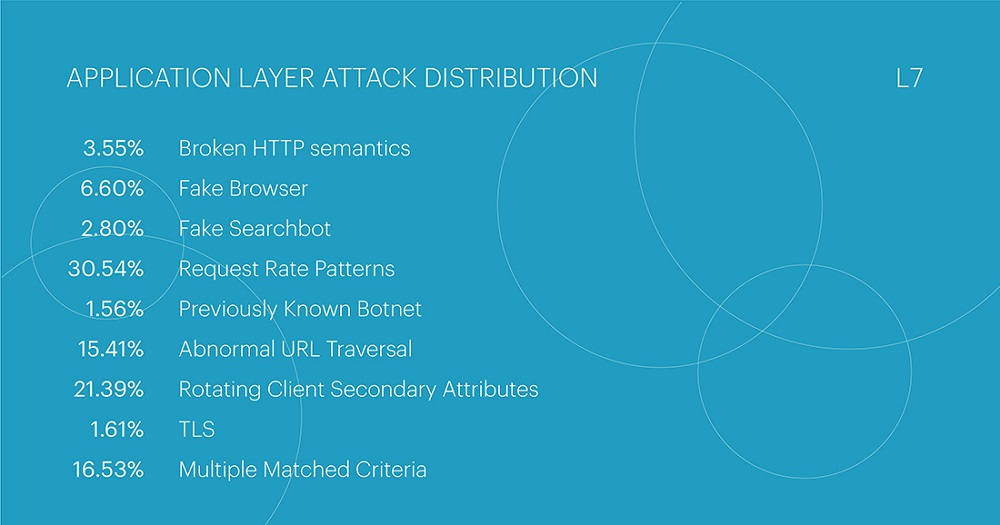
L7 Attacks Distribution
The list of the most popular attack classes has seen a change in leadership. Request Rate Patterns, which are indicators of behavior that deviates from expected legitimate user behavior in terms of request frequency, accounted for 30.54% of all attacks. The change in leadership doesn't result in a significant increase in the Request Rate Patterns class, as its share only increased by 4.72% compared to the previous quarter. The reason for this is the significant decrease in the share of the Rotating Client Secondary Attributes class, which consists of an unusual set of headers in requests. The previous quarter's leader now occupies the second position with a rate of 21.39%, which is 11.58% lower than the previous quarter. The top three includes multi-class attacks, which combine two or more attack classes, at 16.53%. Their share increased by 4% compared to the previous quarter.
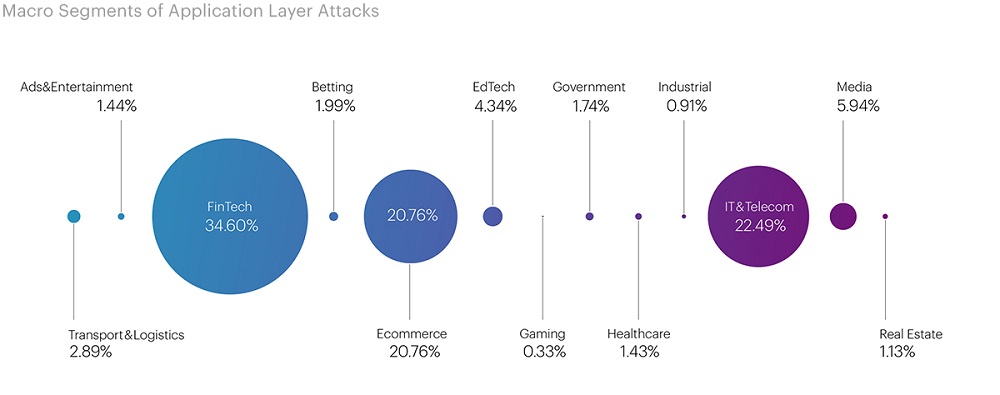
The majority of L7 attacks in the third quarter were directed at the Financial Technology segment, accounting for 34.60% of all attacks (in the second quarter, this segment was in the second position at 24.85%). The IT and Telecom segment took second place with 22.49% of all attacks (in the third position of the second-quarter ranking at 13.08%). The Electronic Commerce segment completed the top three most targeted segments at this level with 20.76% (the leader in the second quarter with a rate of 33.04%).
When delving into micro-segments, differences from attacks at the infrastructure level (L3-L4) become apparent. While malicious actors often targeted banks at the network and transport levels, at the application level, the focus of attacks shifted to Payment Systems, which took the first position with 17.17% of all attacks. The top three leaders of L7 attacks also included Software Services (14.55%) and Retail (9.25%). In contrast, at L3-L4, Classifieds took second place, and Retail took third.
Among the most commonly used attack classes on Payment Systems, Request Rate Patterns were the most prevalent at 34.17%, followed by Multi-Class Attacks at 18.85%, and Abnormal URL Traversal at 16.67% (the fourth most popular attack class in the third quarter was 15.41%). Request Rate Patterns are used most frequently by malicious actors due to their simplicity. In this segment, the Rotating Client Secondary Attributes class occupied only the fourth position at 13.7%, whereas in the previous quarter, the class Fake Browser held that spot (11% in the second quarter).
Additionally, it's worth noting that the Banking (8.10%) and Food retail (7.85%) segments were not overlooked by malicious actors. The combined share of the five most targeted segments accounts for over half, specifically 56.92%, of all application-level attacks.
| L3-L4 | L7 | ||
| Ranking (in descending order) | Share | Ranking (in descending order) | Share |
|
Financial Sector: Banks |
36,01% |
Financial Sector: Payment systems |
17,17% |
| E-commerce: Classifieds | 16,94% | IT and Telecom: Software services | 14,55% |
| E-commerce: Retail | 11,80% | E-commerce: Retail | 9,25% |
| Educational Technology: Online Education | 5,45% | Financial Sector: Banks | 8,10% |
| Financial Sector: Payment systems | 4,54% | E-commerce: Food Retail | 7,85% |
The ranking of attacks with the highest Requests Per Second (RPS) in the third quarter was led by Request Rate Patterns. This class was used in an attack on the Classified s segment, reaching a peak frequency of 978.4 thousand requests per second. This segment didn't make it into any of the application-level attack rankings, but we recorded the highest request frequency for the entire first nine months of 2023. This exceeds the second-quarter figure by more than 633%. The attack lasted just one minute and was part of a multi-class series of attacks on this segment from September 24th to 30th. In total, there were 18 attacks on one domain within this series.
While these attacks were not long-lasting, peaking at just 2.5 minutes, similar to attacks at L3-L4 levels, there are signs of a commercial (ordered) DDoS attack, as mentioned earlier. In addition to the aforementioned class, the attack also used the classes Fake Browser, Rotating Client Secondary Attributes, and Abnormal URL Traversal. Notably, the botnet used for the attack consisted of only 3,246 devices. The average number of devices across all botnets involved in this series of attacks was only 17,092 devices.
The second most intense attack was recorded in the Hosting segment, reaching 445.7 thousand requests per second and lasting 2 minutes. Closing out the top three was an attack with 287.9 thousand requests per second on the Payment Systems segment, which lasted 2.5 minutes.
The longest-lasting application-level attack was recorded in the E-commerce segment (Retail). The attack, with an intensity of only 527 requests per second, lasted more than three days (73.06 hours). The second-longest attack was in the Software services segment (IT and Telecom) for 10.35 hours, and the third was in the Online Education segment for 10.15 hours. In all three cases, the attacks were multi-class (utilizing two or more attack classes).
The average duration of application-level attacks in the third quarter was approximately 20 minutes, with an average intensity of 4.9 thousand requests per second.
Bot Protection Statistics
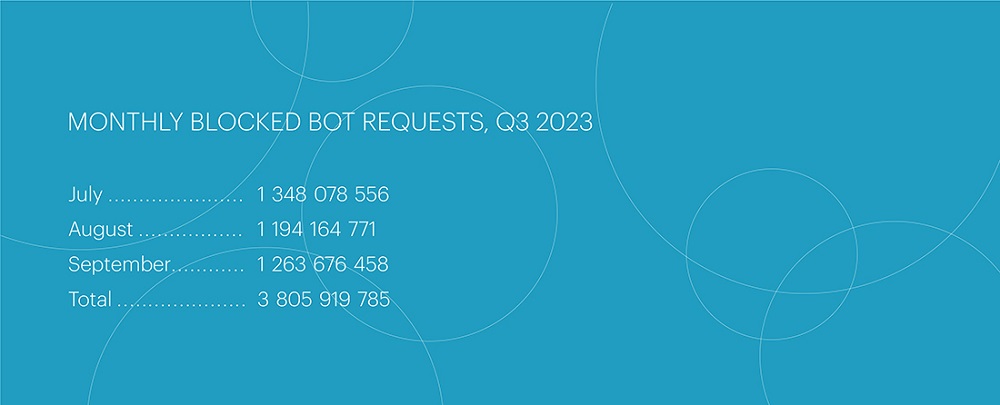
Compared to the second quarter, the number of bot attacks decreased by 10%, totaling 3,805,919,785. Peak values in the third quarter were lower, and there were no record-breaking bot surge attacks in terms of volume and duration that would significantly stand out from everyday activity. The most active month in the third quarter was July, with the highest number of attacks: 1.35 billion blocked bot requests.
The segments of betting and online retail have remained at the top of the attackers' list for the third quarter in a row. In the third quarter, their shares were 39.7% and 23.9%, respectively. The third and fourth positions, as in the previous period, were occupied by pharmaceuticals (9.5%) and financial organizations (1.3%).
The number of background and bot incidents in the online pharmacy segment nearly doubled in comparison to the second quarter of 2023. Serious botnets that were previously targeting retail and entertainment resources, such as betting, are now actively used in the internet pharmacy sector, where their resources are fully utilized.
The largest bot attack occurred in the betting sector on September 24th. On that day, 24,255,701 attacks were recorded, which was, however, nearly 10 million fewer than the peak attack in the same segment during the second quarter. The fastest attack, as in the previous period, took place on the same day, September 24th, in the e-commerce segment. The attack's speed reached 43,644 bot requests per second (RPS), which is 3.5 times higher than the fastest attack in the second quarter, also occurring in the e-commerce segment.
Bot attacks have increased in duration but have decreased in sharp spikes. The primary contributor to bot activity now is background mode: attacks that create a continuous load on the target's resources 24/7 without sharp fluctuations. A good illustration of this is that the record load values per day and single bot attack incidents are now much lower than in the previous quarter. For example, the largest attack in the current quarter was 30% weaker than the previous period's figures, but the total number of bot requests was only 10% lower. This indicates that most of the effort has shifted to background load.
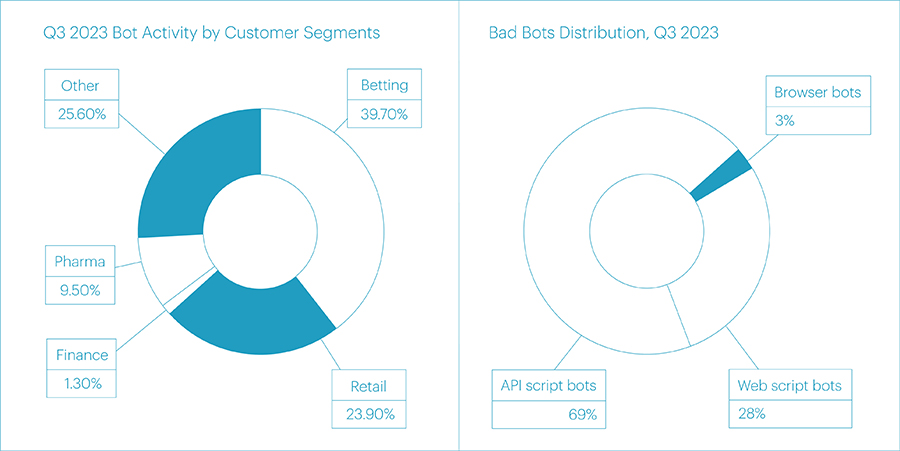
The most exploited methods of bot distribution have become API scripts (69%), Web scripts (28%), and Browsers (3%). The average daily number of bot requests this time amounted to 41,823,294, a decrease of almost 5 million requests compared to the previous period.
Bot attacks are now being terminated more quickly by their organizers when they encounter countermeasures from antibot systems. While in the second quarter, it often happened that after neutralizing an attack, it could linger for another week and create unnecessary background noise that blocked the defense, the duration of massive attacks has now become shorter, and the background noise decreases almost to zero until the attackers begin to try new attack vectors or new resources.
The popularity of new tools for scraping and browser automation (new Chrome headless) is currently lower than expected. They are not prominent in massive surges and do not stand out in the overall attack landscape. However, this could be the calm before the storm. We anticipate widespread use of previously unnoticed bot activity vectors in the fourth quarter, especially during Black Friday.
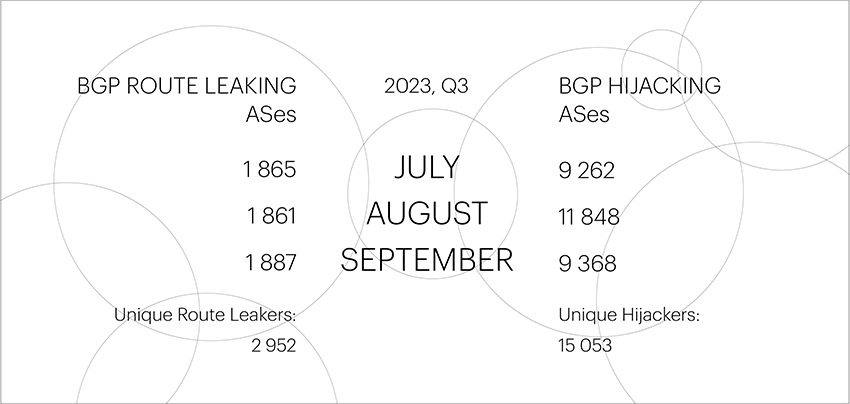
BGP Incidents
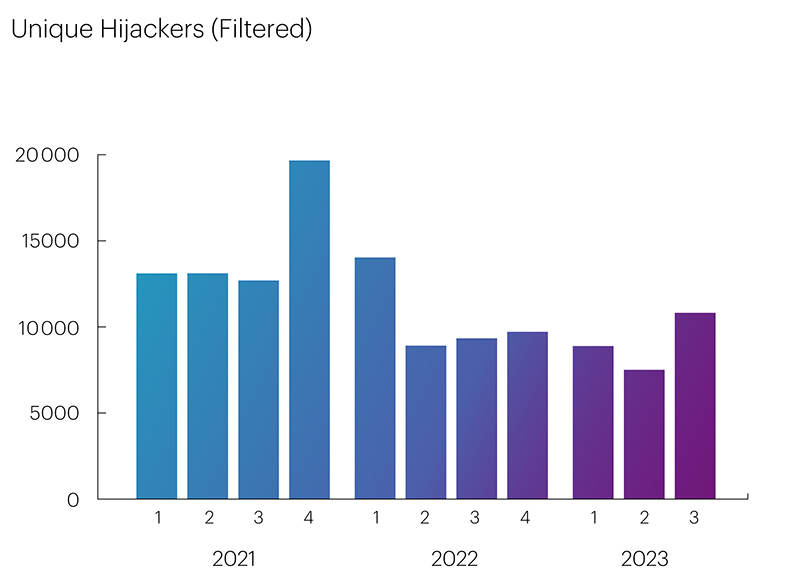
The number of unique autonomous systems involved in Route Leaks in the third quarter remained at roughly the same level as in the previous period. However, the number of unique autonomous systems conducting BGP Hijacks increased by almost two-fold, from 7,595 to 15,053.
Despite the increased number of BGP Hijacking ASes in the third quarter, there is a clear trend of reduction in their count on an annual basis.
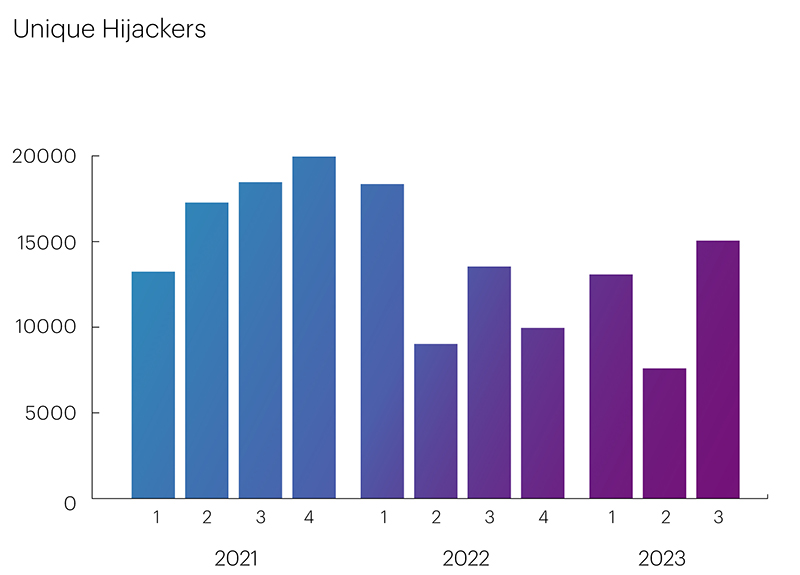
The peak in the number of BGP Hijackers occurred in the fourth quarter of 2021 and the first quarter of 2022, reaching 19,960 and 18,352, respectively, after which their numbers began to decline, reaching minimal values in the second quarter of this year - 7,595.
The reduction is primarily due to the widespread implementation of RPKI ROA-based validation. On the one hand, the number of ROA records in RPKI repositories is increasing, and providers are protecting their inbound traffic. On the other hand, the implementation of drop-invalid policies on the networks of major operators helps reduce the propagation of invalid prefixes, thereby protecting users' outgoing traffic from entering Autonomous Systems with invalid announcements. Consequently, from the perspective of our monitoring system, this leads to a decrease in the visibility of autonomous systems engaging in BGP Hijacking.
However, the third quarter of this year was an exception to the rule, with increased indicators sharply contrasting with the overall decrease in the number of BGP Hijackers.
The Qrator.Radar team conducted research into this unusual spike, during which they identified the automated announcement of IPv6 prefixes by autonomous systems in the APNIC range (AS numbers from 142067 to 146745), which usually have minimal participation in global routing. These announcements resulted in an uncharacteristic increase in the number of unique ASNs by approximately 4,000 each month.
The reason for this was the actions of the China Education and Research Network (CERN), an educational and research network in China, which was likely aimed at the development of the Chinese Next Generation Internet (CNGI) based on the use of IPv6. However, from the perspective of global routing, announcing prefixes on behalf of third-party ASes is not considered good practice. After filtering the data for the third quarter and excluding the interception of address space by the Chinese network, a clearer graph was obtained, showing that the number of unique BGP Hijackers was indeed decreasing compared to a series of periods in 2021 and 2022, and the trend became even more evident.
Unfortunately, the RPKI ROA mechanism does not allow for preventing Route Leaks, and the trend of reducing the number of BGP Hijackers, is practically not evident for BGP Route Leakers. Their numbers change very insignificantly from quarter to quarter.
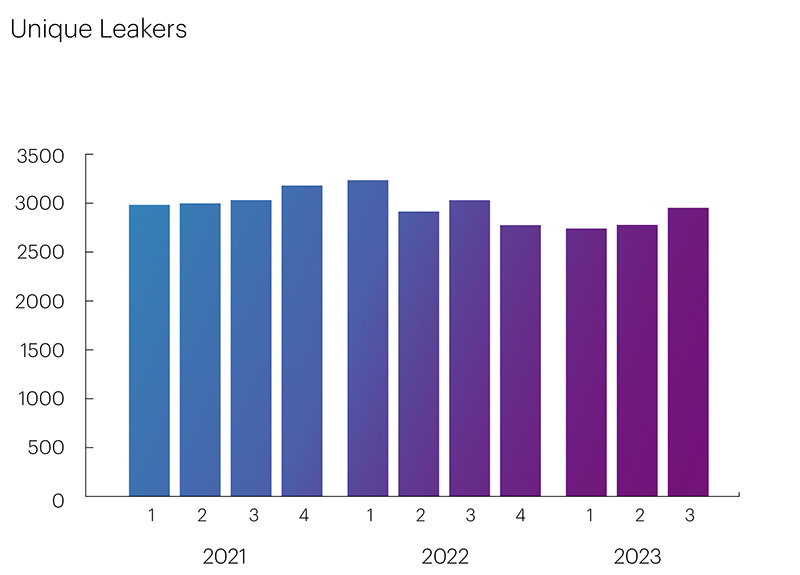
To reduce the number of ASes causing Route Leaks, it is necessary to implement the ASPA protection mechanism based on AS_PATH validation. This mechanism, like RPKI ROA, operates on the well-established RPKI infrastructure and can address the majority of BGP incidents.
Global BGP Incidents
The Qrator.Radar team has a set of specific threshold values that distinguish global incidents from all others. These include the number of affected prefixes, autonomous systems, and the extent of anomaly distribution across routing tables.
In contrast to the previous period, the third quarter of 2023 witnessed an increase in global Route Leaks.
| Global BGP Route Leaks | Global BGP Hijacks |
| July: 3 August: 2 September: 1 |
July: 0 August: 1 September: 0 |
A detailed analysis of the propagation and impact on traffic of two incidents detected by us, occurring on August 28 and 29, was conducted by our colleague Doug Madory in Kentik's blog, and a full description of all incidents by their occurrence date can be found on the Qrator.Radar Twitter feed.
Key findings:
- UDP flooding continued to gain momentum, setting a new record of 66.92% of the total attacks in mixed values and 64.13% in absolute numbers.
- Complex (mixed) attacks stood out with the highest duration and throughput.
- For the third consecutive year, we have observed a seasonal decline in the overall number of attacks in the third quarter. This year, the figure decreased by 13.46%, further indicating a shift in attacker behavior towards UDP.
- The longest attack was recorded in late August, targeting the Transport and Logistics segment (airports) and lasting almost three days (71 hours and 58 minutes).
- In the third quarter, just like in the previous quarter, the Financial sector suffered the most from attacks - 42.06%.
- The most targeted micro-segments were banks, classifieds, and retail, which can be attributed to preparations and the start of the autumn season.
- Commercial attacks are regaining popularity this year due to the expansion of communication channels, the transition to new protocols for optimizing remote offices, and the ease and low cost of organization.
- To bypass geoblocking, attackers have become more active in using local traffic sources, as close as possible to the region of their victims, leading to a 116.42% increase in the total number of blocked IP addresses compared to the second quarter.
- The number of L7 attacks continues to decline (decreasing by another 26.67%), with attacks becoming very targeted and not mass-scale.
- The majority of attacks at the L7 level targeted the Financial Technology segment (34.60%). The second place was occupied by the IT and Telecom segment (22.49% of all attacks), while E-commerce ranked third (20.76%).
- In comparison to the second quarter, the number of bot attacks decreased by 10%. The most active month in the third quarter was July, with the highest number of attacks: 1.35 billion blocked bot requests.
- The segments of Betting and Online retail have remained at the top of the list for bot incidents for the third quarter in a row.
- In spite of the fact that the number of unique autonomous systems BGP Hijacks increased by almost 2 times in the third quarter, there is a clear trend of their decrease on an annual basis.
- The implementation of RPKI ROA-based validation continues to have a significant impact on reducing the number of BGP Hijackers.
Other findings:
- A series of attacks with the maximum throughput was recorded in the IT and Telecom segment, targeting a hosting platform attacked in four vectors with peak loads.
- The number of the largest botnet decreased by almost half compared to the second quarter, totaling 85,298 devices.
- In the third quarter, attacks with the highest requests per second (RPS) were led by the Request Rate Patterns class, used in an attack on the Classifieds segment with a peak frequency of 978.4 thousand requests per second.
- The longest application-level attack was observed in the Retail segment, lasting over three days (73.06 hours) with an intensity of only 527 requests per second. The second longest attack targeted the Software services segment (IT and Telecom) at 10.35 hours, and the third place was taken by the Online education segment at 10.15 hours. All three attacks were multi-class attacks.
- Bot attacks have increased in duration but have decreased in sharp spikes. The main bot activity is now achieved through background mode: attacks that create a continuous load on the target's resources 24/7 without sharp fluctuations.
- In the third quarter, there was a spike in the number of BGP Hijackers due to the actions of the China Education and Research Network (CERN), likely aimed at the development of the Chinese Next Generation Internet (CNGI), based on the use of IPv6.
- The number of Route Leaks changes very insignificantly from quarter to quarter. To reduce the number of ASes (Autonomous Systems) causing Route Leaks, it is necessary to implement the ASPA protection mechanism based on AS_PATH validation.
Remarks
Web script bots: scripted routines that make direct requests to download web pages and parse the content of the page for certain data without the need for a browser or an external application.
API Script Bots: Scripted routines that make direct API calls to the backend of a web or mobile app to download the required data, ignoring the external interface.
Browser Bots: High-level automation platforms that work with standalone or modified web browsers and have most of the human user experience.